Black/African American vs Central American Indian Unemployment
COMPARE
Black/African American
Central American Indian
Unemployment
Unemployment Comparison
Blacks/African Americans
Central American Indians
6.6%
UNEMPLOYMENT
0.0/ 100
METRIC RATING
314th/ 347
METRIC RANK
6.2%
UNEMPLOYMENT
0.0/ 100
METRIC RATING
292nd/ 347
METRIC RANK
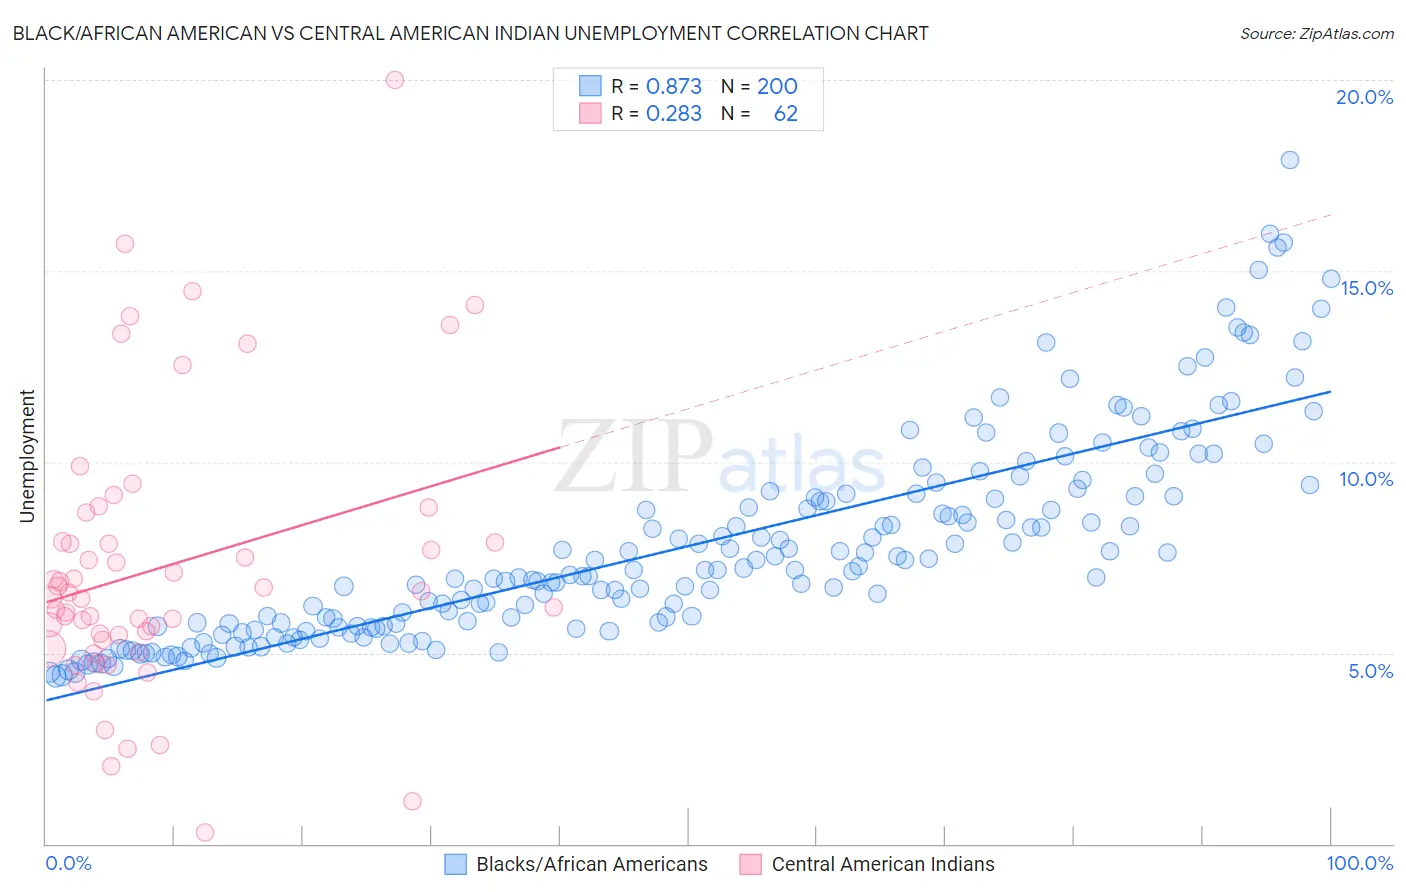
Black/African American vs Central American Indian Unemployment Correlation Chart
The statistical analysis conducted on geographies consisting of 562,987,434 people shows a very strong positive correlation between the proportion of Blacks/African Americans and unemployment in the United States with a correlation coefficient (R) of 0.873 and weighted average of 6.6%. Similarly, the statistical analysis conducted on geographies consisting of 325,961,025 people shows a weak positive correlation between the proportion of Central American Indians and unemployment in the United States with a correlation coefficient (R) of 0.283 and weighted average of 6.2%, a difference of 6.3%.
Unemployment Correlation Summary
| Measurement | Black/African American | Central American Indian |
| Minimum | 4.4% | 0.30% |
| Maximum | 17.9% | 20.0% |
| Range | 13.5% | 19.7% |
| Mean | 7.8% | 7.2% |
| Median | 7.1% | 6.5% |
| Interquartile 25% (IQ1) | 5.7% | 5.3% |
| Interquartile 75% (IQ3) | 9.1% | 7.9% |
| Interquartile Range (IQR) | 3.4% | 2.6% |
| Standard Deviation (Sample) | 2.7% | 3.6% |
| Standard Deviation (Population) | 2.7% | 3.6% |
Similar Demographics by Unemployment
Demographics Similar to Blacks/African Americans by Unemployment
In terms of unemployment, the demographic groups most similar to Blacks/African Americans are Immigrants from Barbados (6.6%, a difference of 0.55%), Houma (6.7%, a difference of 0.80%), Colville (6.6%, a difference of 0.93%), Cape Verdean (6.5%, a difference of 1.5%), and Immigrants from Dominica (6.7%, a difference of 1.6%).
| Demographics | Rating | Rank | Unemployment |
| Immigrants | Bangladesh | 0.0 /100 | #307 | Tragic 6.5% |
| Barbadians | 0.0 /100 | #308 | Tragic 6.5% |
| Vietnamese | 0.0 /100 | #309 | Tragic 6.5% |
| Immigrants | Belize | 0.0 /100 | #310 | Tragic 6.5% |
| Cape Verdeans | 0.0 /100 | #311 | Tragic 6.5% |
| Colville | 0.0 /100 | #312 | Tragic 6.6% |
| Immigrants | Barbados | 0.0 /100 | #313 | Tragic 6.6% |
| Blacks/African Americans | 0.0 /100 | #314 | Tragic 6.6% |
| Houma | 0.0 /100 | #315 | Tragic 6.7% |
| Immigrants | Dominica | 0.0 /100 | #316 | Tragic 6.7% |
| Shoshone | 0.0 /100 | #317 | Tragic 6.8% |
| Immigrants | Cabo Verde | 0.0 /100 | #318 | Tragic 6.8% |
| British West Indians | 0.0 /100 | #319 | Tragic 6.8% |
| Immigrants | St. Vincent and the Grenadines | 0.0 /100 | #320 | Tragic 6.9% |
| Immigrants | Guyana | 0.0 /100 | #321 | Tragic 6.9% |
Demographics Similar to Central American Indians by Unemployment
In terms of unemployment, the demographic groups most similar to Central American Indians are Haitian (6.2%, a difference of 0.020%), Immigrants from Ecuador (6.2%, a difference of 0.090%), Spanish American Indian (6.2%, a difference of 0.090%), U.S. Virgin Islander (6.3%, a difference of 0.22%), and Senegalese (6.2%, a difference of 0.54%).
| Demographics | Rating | Rank | Unemployment |
| Immigrants | Senegal | 0.0 /100 | #285 | Tragic 6.1% |
| Immigrants | Caribbean | 0.0 /100 | #286 | Tragic 6.2% |
| Nepalese | 0.0 /100 | #287 | Tragic 6.2% |
| Ecuadorians | 0.0 /100 | #288 | Tragic 6.2% |
| Chippewa | 0.0 /100 | #289 | Tragic 6.2% |
| Senegalese | 0.0 /100 | #290 | Tragic 6.2% |
| Haitians | 0.0 /100 | #291 | Tragic 6.2% |
| Central American Indians | 0.0 /100 | #292 | Tragic 6.2% |
| Immigrants | Ecuador | 0.0 /100 | #293 | Tragic 6.2% |
| Spanish American Indians | 0.0 /100 | #294 | Tragic 6.2% |
| U.S. Virgin Islanders | 0.0 /100 | #295 | Tragic 6.3% |
| Ute | 0.0 /100 | #296 | Tragic 6.3% |
| Jamaicans | 0.0 /100 | #297 | Tragic 6.3% |
| Immigrants | Haiti | 0.0 /100 | #298 | Tragic 6.3% |
| Immigrants | West Indies | 0.0 /100 | #299 | Tragic 6.3% |