Black/African American vs Immigrants from Sudan Unemployment
COMPARE
Black/African American
Immigrants from Sudan
Unemployment
Unemployment Comparison
Blacks/African Americans
Immigrants from Sudan
6.6%
UNEMPLOYMENT
0.0/ 100
METRIC RATING
314th/ 347
METRIC RANK
5.0%
UNEMPLOYMENT
96.3/ 100
METRIC RATING
91st/ 347
METRIC RANK
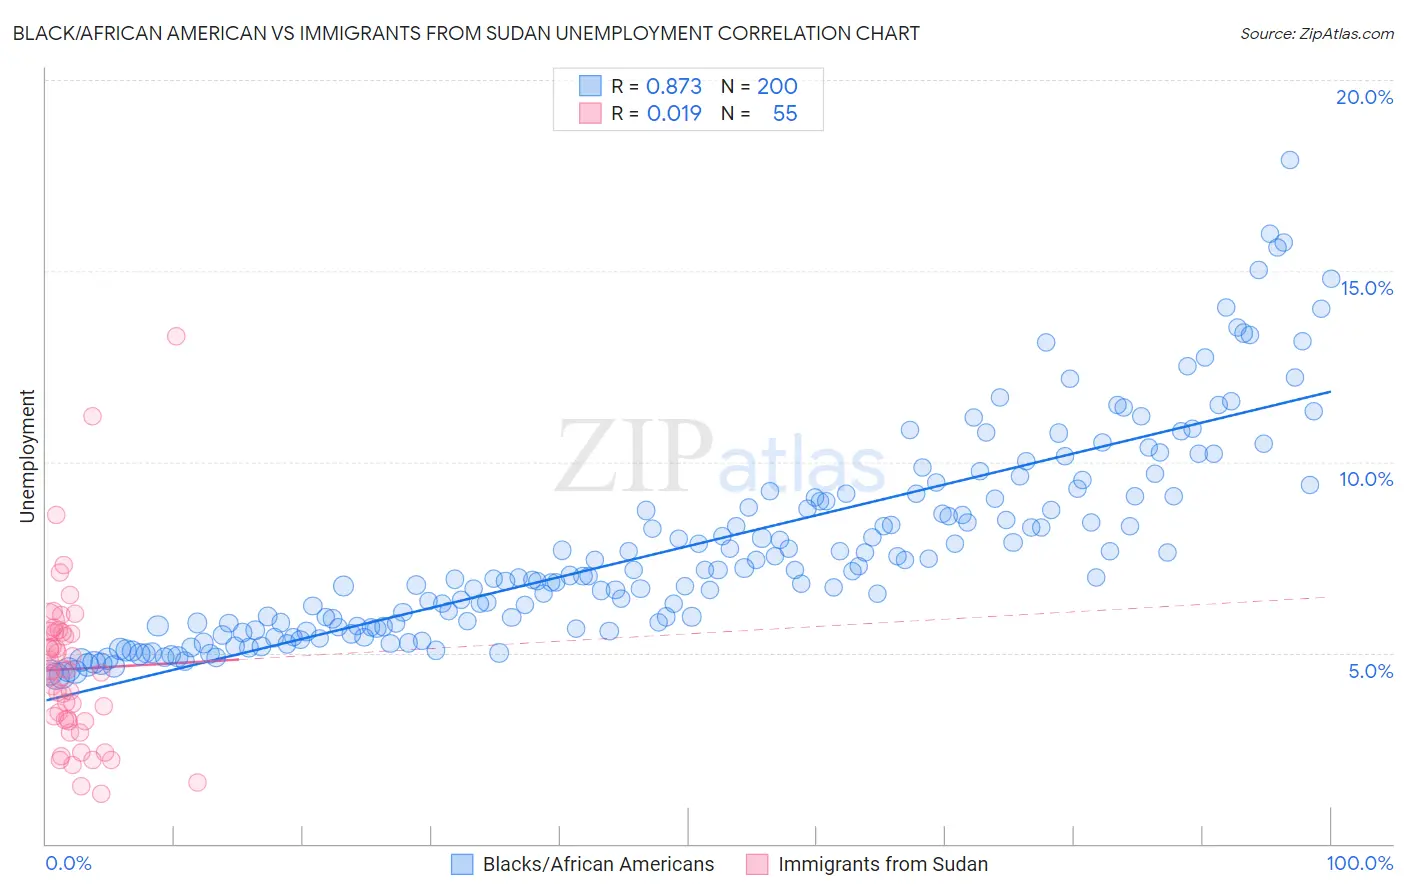
Black/African American vs Immigrants from Sudan Unemployment Correlation Chart
The statistical analysis conducted on geographies consisting of 562,987,434 people shows a very strong positive correlation between the proportion of Blacks/African Americans and unemployment in the United States with a correlation coefficient (R) of 0.873 and weighted average of 6.6%. Similarly, the statistical analysis conducted on geographies consisting of 118,944,450 people shows no correlation between the proportion of Immigrants from Sudan and unemployment in the United States with a correlation coefficient (R) of 0.019 and weighted average of 5.0%, a difference of 32.8%.
Unemployment Correlation Summary
| Measurement | Black/African American | Immigrants from Sudan |
| Minimum | 4.4% | 1.3% |
| Maximum | 17.9% | 13.3% |
| Range | 13.5% | 12.0% |
| Mean | 7.8% | 4.6% |
| Median | 7.1% | 4.5% |
| Interquartile 25% (IQ1) | 5.7% | 3.2% |
| Interquartile 75% (IQ3) | 9.1% | 5.5% |
| Interquartile Range (IQR) | 3.4% | 2.3% |
| Standard Deviation (Sample) | 2.7% | 2.2% |
| Standard Deviation (Population) | 2.7% | 2.2% |
Similar Demographics by Unemployment
Demographics Similar to Blacks/African Americans by Unemployment
In terms of unemployment, the demographic groups most similar to Blacks/African Americans are Immigrants from Barbados (6.6%, a difference of 0.55%), Houma (6.7%, a difference of 0.80%), Colville (6.6%, a difference of 0.93%), Cape Verdean (6.5%, a difference of 1.5%), and Immigrants from Dominica (6.7%, a difference of 1.6%).
| Demographics | Rating | Rank | Unemployment |
| Immigrants | Bangladesh | 0.0 /100 | #307 | Tragic 6.5% |
| Barbadians | 0.0 /100 | #308 | Tragic 6.5% |
| Vietnamese | 0.0 /100 | #309 | Tragic 6.5% |
| Immigrants | Belize | 0.0 /100 | #310 | Tragic 6.5% |
| Cape Verdeans | 0.0 /100 | #311 | Tragic 6.5% |
| Colville | 0.0 /100 | #312 | Tragic 6.6% |
| Immigrants | Barbados | 0.0 /100 | #313 | Tragic 6.6% |
| Blacks/African Americans | 0.0 /100 | #314 | Tragic 6.6% |
| Houma | 0.0 /100 | #315 | Tragic 6.7% |
| Immigrants | Dominica | 0.0 /100 | #316 | Tragic 6.7% |
| Shoshone | 0.0 /100 | #317 | Tragic 6.8% |
| Immigrants | Cabo Verde | 0.0 /100 | #318 | Tragic 6.8% |
| British West Indians | 0.0 /100 | #319 | Tragic 6.8% |
| Immigrants | St. Vincent and the Grenadines | 0.0 /100 | #320 | Tragic 6.9% |
| Immigrants | Guyana | 0.0 /100 | #321 | Tragic 6.9% |
Demographics Similar to Immigrants from Sudan by Unemployment
In terms of unemployment, the demographic groups most similar to Immigrants from Sudan are Immigrants from North Macedonia (5.0%, a difference of 0.010%), Immigrants from South Africa (5.0%, a difference of 0.020%), Jordanian (5.0%, a difference of 0.050%), Ukrainian (5.0%, a difference of 0.11%), and Immigrants from Korea (5.0%, a difference of 0.14%).
| Demographics | Rating | Rank | Unemployment |
| Russians | 97.4 /100 | #84 | Exceptional 5.0% |
| Immigrants | Australia | 97.0 /100 | #85 | Exceptional 5.0% |
| Hungarians | 96.9 /100 | #86 | Exceptional 5.0% |
| Immigrants | Moldova | 96.6 /100 | #87 | Exceptional 5.0% |
| Immigrants | Korea | 96.6 /100 | #88 | Exceptional 5.0% |
| Jordanians | 96.4 /100 | #89 | Exceptional 5.0% |
| Immigrants | North Macedonia | 96.3 /100 | #90 | Exceptional 5.0% |
| Immigrants | Sudan | 96.3 /100 | #91 | Exceptional 5.0% |
| Immigrants | South Africa | 96.2 /100 | #92 | Exceptional 5.0% |
| Ukrainians | 96.0 /100 | #93 | Exceptional 5.0% |
| Immigrants | Austria | 95.9 /100 | #94 | Exceptional 5.0% |
| Immigrants | Serbia | 95.6 /100 | #95 | Exceptional 5.0% |
| Immigrants | England | 95.2 /100 | #96 | Exceptional 5.0% |
| Immigrants | Czechoslovakia | 95.1 /100 | #97 | Exceptional 5.0% |
| Romanians | 95.0 /100 | #98 | Exceptional 5.0% |