Basque vs Puget Sound Salish Male Unemployment
COMPARE
Basque
Puget Sound Salish
Male Unemployment
Male Unemployment Comparison
Basques
Puget Sound Salish
5.0%
MALE UNEMPLOYMENT
97.9/ 100
METRIC RATING
62nd/ 347
METRIC RANK
5.5%
MALE UNEMPLOYMENT
5.6/ 100
METRIC RATING
214th/ 347
METRIC RANK
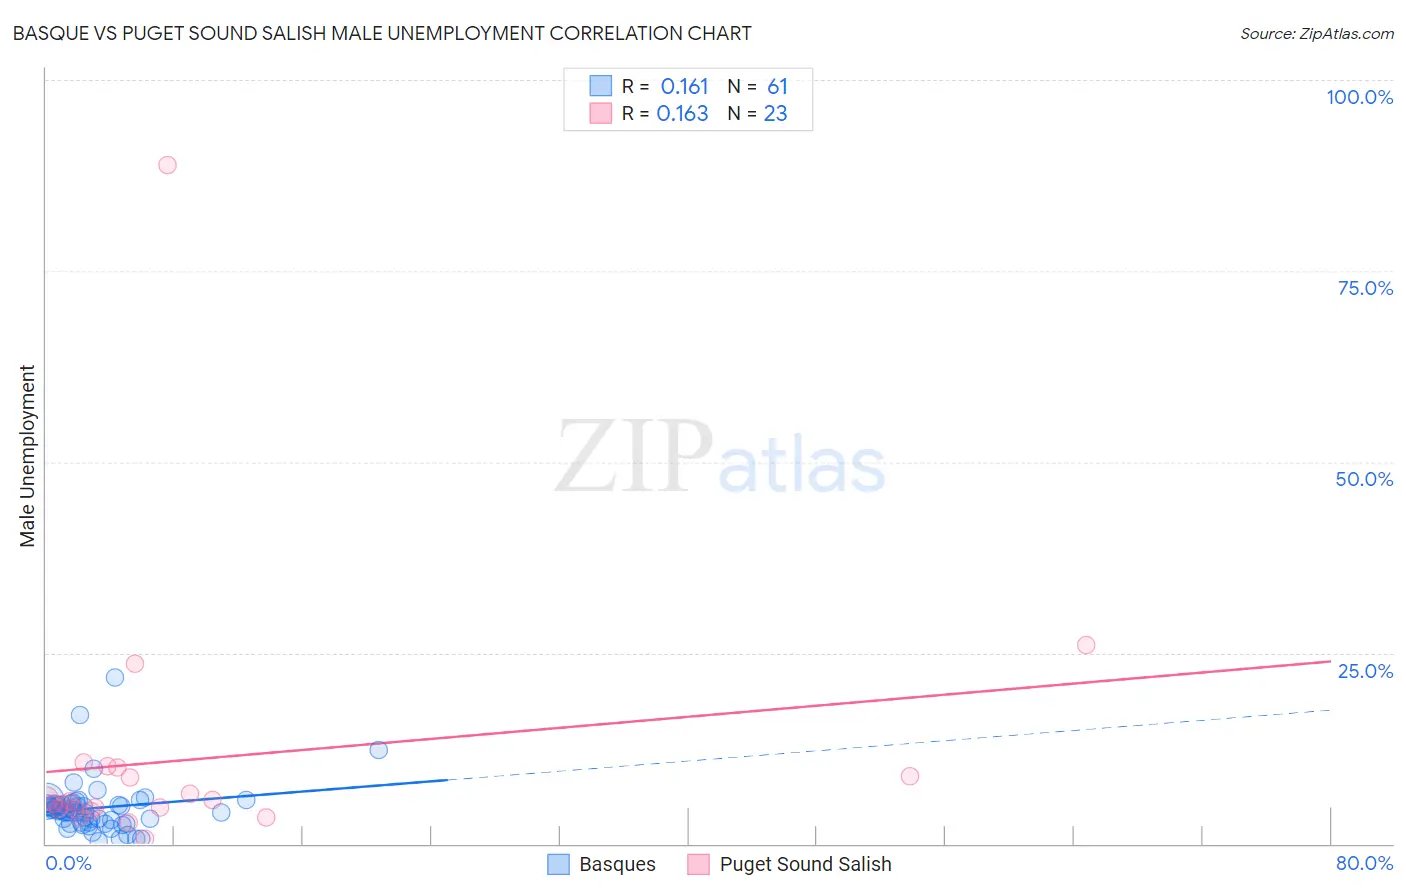
Basque vs Puget Sound Salish Male Unemployment Correlation Chart
The statistical analysis conducted on geographies consisting of 165,517,364 people shows a poor positive correlation between the proportion of Basques and unemployment rate among males in the United States with a correlation coefficient (R) of 0.161 and weighted average of 5.0%. Similarly, the statistical analysis conducted on geographies consisting of 46,067,216 people shows a poor positive correlation between the proportion of Puget Sound Salish and unemployment rate among males in the United States with a correlation coefficient (R) of 0.163 and weighted average of 5.5%, a difference of 10.3%.
Male Unemployment Correlation Summary
| Measurement | Basque | Puget Sound Salish |
| Minimum | 0.30% | 0.60% |
| Maximum | 21.8% | 88.9% |
| Range | 21.5% | 88.3% |
| Mean | 4.7% | 11.1% |
| Median | 4.4% | 5.5% |
| Interquartile 25% (IQ1) | 2.8% | 4.6% |
| Interquartile 75% (IQ3) | 5.2% | 10.0% |
| Interquartile Range (IQR) | 2.4% | 5.4% |
| Standard Deviation (Sample) | 3.4% | 18.0% |
| Standard Deviation (Population) | 3.4% | 17.6% |
Similar Demographics by Male Unemployment
Demographics Similar to Basques by Male Unemployment
In terms of male unemployment, the demographic groups most similar to Basques are Eastern European (5.0%, a difference of 0.010%), Celtic (5.0%, a difference of 0.030%), Cambodian (5.0%, a difference of 0.13%), Icelander (5.0%, a difference of 0.19%), and Immigrants from Argentina (5.0%, a difference of 0.20%).
| Demographics | Rating | Rank | Male Unemployment |
| Czechoslovakians | 98.7 /100 | #55 | Exceptional 5.0% |
| Immigrants | Bulgaria | 98.7 /100 | #56 | Exceptional 5.0% |
| Turks | 98.5 /100 | #57 | Exceptional 5.0% |
| Lithuanians | 98.5 /100 | #58 | Exceptional 5.0% |
| Immigrants | Netherlands | 98.3 /100 | #59 | Exceptional 5.0% |
| Immigrants | Argentina | 98.1 /100 | #60 | Exceptional 5.0% |
| Cambodians | 98.1 /100 | #61 | Exceptional 5.0% |
| Basques | 97.9 /100 | #62 | Exceptional 5.0% |
| Eastern Europeans | 97.9 /100 | #63 | Exceptional 5.0% |
| Celtics | 97.8 /100 | #64 | Exceptional 5.0% |
| Icelanders | 97.6 /100 | #65 | Exceptional 5.0% |
| Finns | 97.5 /100 | #66 | Exceptional 5.0% |
| Immigrants | Canada | 97.5 /100 | #67 | Exceptional 5.0% |
| Australians | 97.4 /100 | #68 | Exceptional 5.0% |
| Immigrants | Sweden | 97.4 /100 | #69 | Exceptional 5.0% |
Demographics Similar to Puget Sound Salish by Male Unemployment
In terms of male unemployment, the demographic groups most similar to Puget Sound Salish are Ugandan (5.5%, a difference of 0.17%), Samoan (5.5%, a difference of 0.20%), Hmong (5.5%, a difference of 0.33%), Immigrants (5.5%, a difference of 0.37%), and Delaware (5.5%, a difference of 0.42%).
| Demographics | Rating | Rank | Male Unemployment |
| Immigrants | Syria | 9.3 /100 | #207 | Tragic 5.5% |
| Immigrants | Lebanon | 8.6 /100 | #208 | Tragic 5.5% |
| Immigrants | Middle Africa | 8.3 /100 | #209 | Tragic 5.5% |
| South American Indians | 7.6 /100 | #210 | Tragic 5.5% |
| Israelis | 7.4 /100 | #211 | Tragic 5.5% |
| Hmong | 7.0 /100 | #212 | Tragic 5.5% |
| Ugandans | 6.3 /100 | #213 | Tragic 5.5% |
| Puget Sound Salish | 5.6 /100 | #214 | Tragic 5.5% |
| Samoans | 4.9 /100 | #215 | Tragic 5.5% |
| Immigrants | Immigrants | 4.3 /100 | #216 | Tragic 5.5% |
| Delaware | 4.2 /100 | #217 | Tragic 5.5% |
| Immigrants | Albania | 3.6 /100 | #218 | Tragic 5.5% |
| Immigrants | Western Asia | 3.5 /100 | #219 | Tragic 5.6% |
| Portuguese | 3.5 /100 | #220 | Tragic 5.6% |
| Soviet Union | 3.2 /100 | #221 | Tragic 5.6% |