Scandinavian vs Puget Sound Salish Male Unemployment
COMPARE
Scandinavian
Puget Sound Salish
Male Unemployment
Male Unemployment Comparison
Scandinavians
Puget Sound Salish
4.7%
MALE UNEMPLOYMENT
100.0/ 100
METRIC RATING
15th/ 347
METRIC RANK
5.5%
MALE UNEMPLOYMENT
5.6/ 100
METRIC RATING
214th/ 347
METRIC RANK
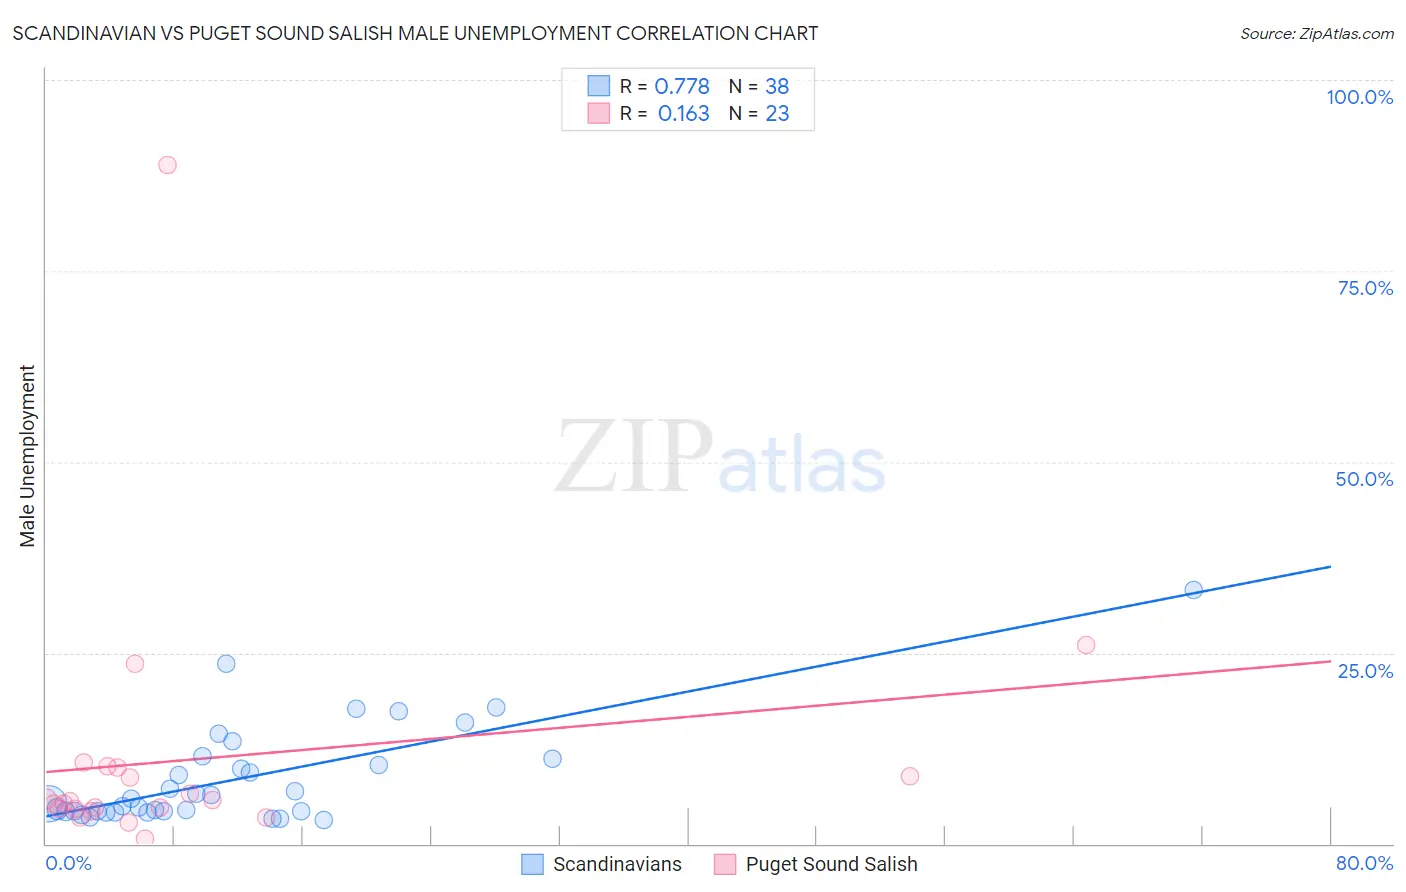
Scandinavian vs Puget Sound Salish Male Unemployment Correlation Chart
The statistical analysis conducted on geographies consisting of 467,906,734 people shows a strong positive correlation between the proportion of Scandinavians and unemployment rate among males in the United States with a correlation coefficient (R) of 0.778 and weighted average of 4.7%. Similarly, the statistical analysis conducted on geographies consisting of 46,067,216 people shows a poor positive correlation between the proportion of Puget Sound Salish and unemployment rate among males in the United States with a correlation coefficient (R) of 0.163 and weighted average of 5.5%, a difference of 17.2%.
Male Unemployment Correlation Summary
| Measurement | Scandinavian | Puget Sound Salish |
| Minimum | 3.1% | 0.60% |
| Maximum | 33.3% | 88.9% |
| Range | 30.2% | 88.3% |
| Mean | 8.6% | 11.1% |
| Median | 5.6% | 5.5% |
| Interquartile 25% (IQ1) | 4.2% | 4.6% |
| Interquartile 75% (IQ3) | 11.1% | 10.0% |
| Interquartile Range (IQR) | 6.9% | 5.4% |
| Standard Deviation (Sample) | 6.6% | 18.0% |
| Standard Deviation (Population) | 6.5% | 17.6% |
Similar Demographics by Male Unemployment
Demographics Similar to Scandinavians by Male Unemployment
In terms of male unemployment, the demographic groups most similar to Scandinavians are Swiss (4.7%, a difference of 0.050%), German (4.7%, a difference of 0.27%), Bolivian (4.7%, a difference of 0.29%), Filipino (4.7%, a difference of 0.78%), and Immigrants from Bolivia (4.7%, a difference of 0.97%).
| Demographics | Rating | Rank | Male Unemployment |
| Luxembourgers | 100.0 /100 | #8 | Exceptional 4.5% |
| Thais | 100.0 /100 | #9 | Exceptional 4.6% |
| Cubans | 100.0 /100 | #10 | Exceptional 4.6% |
| Swedes | 100.0 /100 | #11 | Exceptional 4.6% |
| Immigrants | Bolivia | 100.0 /100 | #12 | Exceptional 4.7% |
| Bolivians | 100.0 /100 | #13 | Exceptional 4.7% |
| Germans | 100.0 /100 | #14 | Exceptional 4.7% |
| Scandinavians | 100.0 /100 | #15 | Exceptional 4.7% |
| Swiss | 99.9 /100 | #16 | Exceptional 4.7% |
| Filipinos | 99.9 /100 | #17 | Exceptional 4.7% |
| English | 99.9 /100 | #18 | Exceptional 4.8% |
| Europeans | 99.9 /100 | #19 | Exceptional 4.8% |
| Pennsylvania Germans | 99.9 /100 | #20 | Exceptional 4.8% |
| Immigrants | Taiwan | 99.9 /100 | #21 | Exceptional 4.8% |
| Carpatho Rusyns | 99.9 /100 | #22 | Exceptional 4.8% |
Demographics Similar to Puget Sound Salish by Male Unemployment
In terms of male unemployment, the demographic groups most similar to Puget Sound Salish are Ugandan (5.5%, a difference of 0.17%), Samoan (5.5%, a difference of 0.20%), Hmong (5.5%, a difference of 0.33%), Immigrants (5.5%, a difference of 0.37%), and Delaware (5.5%, a difference of 0.42%).
| Demographics | Rating | Rank | Male Unemployment |
| Immigrants | Syria | 9.3 /100 | #207 | Tragic 5.5% |
| Immigrants | Lebanon | 8.6 /100 | #208 | Tragic 5.5% |
| Immigrants | Middle Africa | 8.3 /100 | #209 | Tragic 5.5% |
| South American Indians | 7.6 /100 | #210 | Tragic 5.5% |
| Israelis | 7.4 /100 | #211 | Tragic 5.5% |
| Hmong | 7.0 /100 | #212 | Tragic 5.5% |
| Ugandans | 6.3 /100 | #213 | Tragic 5.5% |
| Puget Sound Salish | 5.6 /100 | #214 | Tragic 5.5% |
| Samoans | 4.9 /100 | #215 | Tragic 5.5% |
| Immigrants | Immigrants | 4.3 /100 | #216 | Tragic 5.5% |
| Delaware | 4.2 /100 | #217 | Tragic 5.5% |
| Immigrants | Albania | 3.6 /100 | #218 | Tragic 5.5% |
| Immigrants | Western Asia | 3.5 /100 | #219 | Tragic 5.6% |
| Portuguese | 3.5 /100 | #220 | Tragic 5.6% |
| Soviet Union | 3.2 /100 | #221 | Tragic 5.6% |