Iranian vs Puget Sound Salish Male Unemployment
COMPARE
Iranian
Puget Sound Salish
Male Unemployment
Male Unemployment Comparison
Iranians
Puget Sound Salish
5.0%
MALE UNEMPLOYMENT
96.4/ 100
METRIC RATING
77th/ 347
METRIC RANK
5.5%
MALE UNEMPLOYMENT
5.6/ 100
METRIC RATING
214th/ 347
METRIC RANK
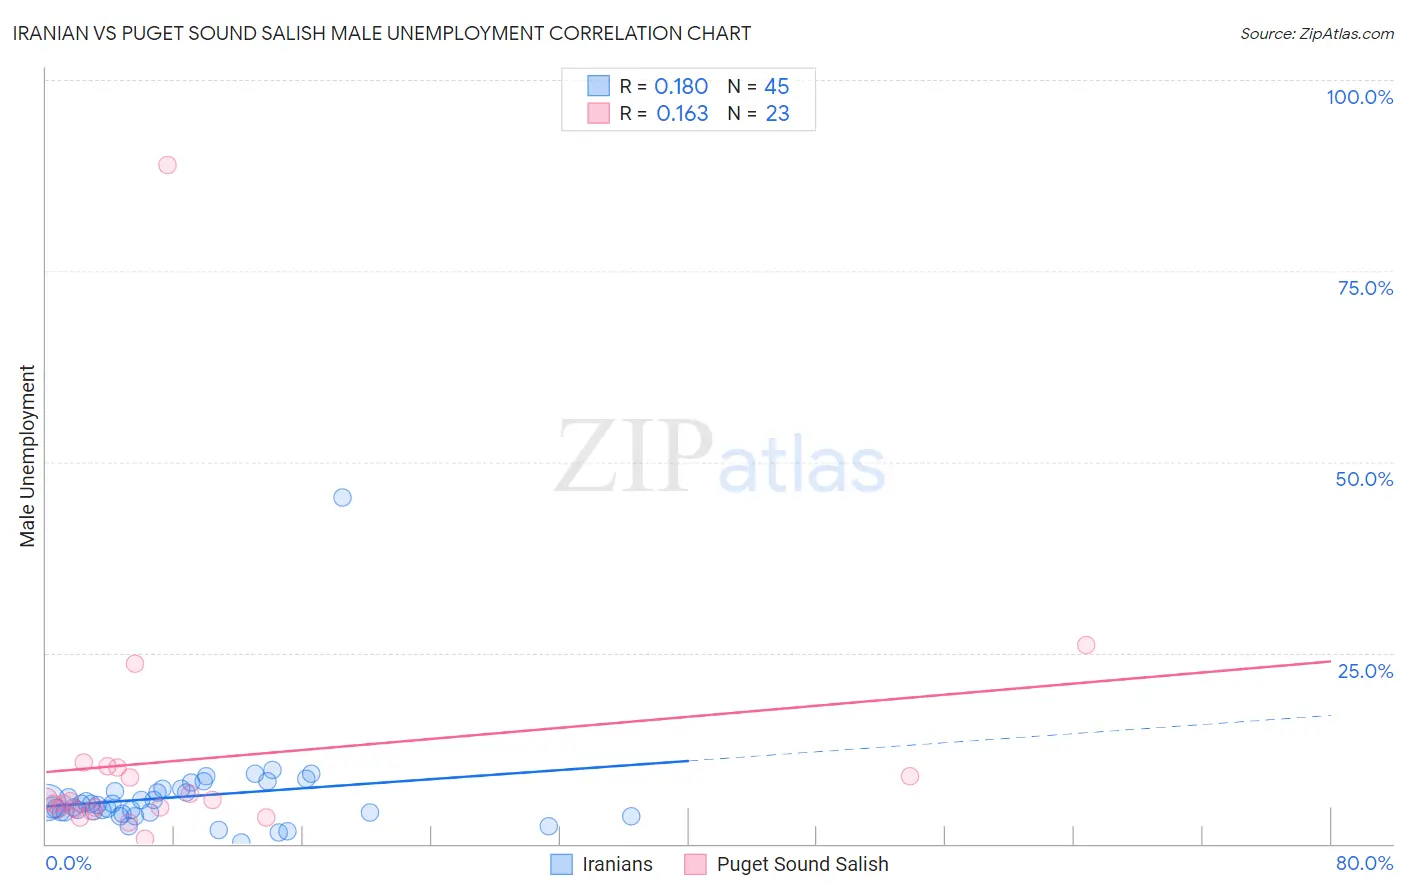
Iranian vs Puget Sound Salish Male Unemployment Correlation Chart
The statistical analysis conducted on geographies consisting of 316,157,253 people shows a poor positive correlation between the proportion of Iranians and unemployment rate among males in the United States with a correlation coefficient (R) of 0.180 and weighted average of 5.0%. Similarly, the statistical analysis conducted on geographies consisting of 46,067,216 people shows a poor positive correlation between the proportion of Puget Sound Salish and unemployment rate among males in the United States with a correlation coefficient (R) of 0.163 and weighted average of 5.5%, a difference of 9.4%.
Male Unemployment Correlation Summary
| Measurement | Iranian | Puget Sound Salish |
| Minimum | 0.10% | 0.60% |
| Maximum | 45.3% | 88.9% |
| Range | 45.2% | 88.3% |
| Mean | 6.1% | 11.1% |
| Median | 5.1% | 5.5% |
| Interquartile 25% (IQ1) | 4.1% | 4.6% |
| Interquartile 75% (IQ3) | 7.0% | 10.0% |
| Interquartile Range (IQR) | 2.9% | 5.4% |
| Standard Deviation (Sample) | 6.4% | 18.0% |
| Standard Deviation (Population) | 6.3% | 17.6% |
Similar Demographics by Male Unemployment
Demographics Similar to Iranians by Male Unemployment
In terms of male unemployment, the demographic groups most similar to Iranians are Immigrants from Northern Europe (5.0%, a difference of 0.010%), South African (5.0%, a difference of 0.020%), Immigrants from Sudan (5.0%, a difference of 0.050%), Argentinean (5.0%, a difference of 0.080%), and French (5.0%, a difference of 0.080%).
| Demographics | Rating | Rank | Male Unemployment |
| Whites/Caucasians | 97.3 /100 | #70 | Exceptional 5.0% |
| New Zealanders | 97.3 /100 | #71 | Exceptional 5.0% |
| Immigrants | South Africa | 97.1 /100 | #72 | Exceptional 5.0% |
| Greeks | 97.0 /100 | #73 | Exceptional 5.0% |
| Immigrants | North America | 96.9 /100 | #74 | Exceptional 5.0% |
| Assyrians/Chaldeans/Syriacs | 96.9 /100 | #75 | Exceptional 5.0% |
| Immigrants | Sudan | 96.5 /100 | #76 | Exceptional 5.0% |
| Iranians | 96.4 /100 | #77 | Exceptional 5.0% |
| Immigrants | Northern Europe | 96.4 /100 | #78 | Exceptional 5.0% |
| South Africans | 96.4 /100 | #79 | Exceptional 5.0% |
| Argentineans | 96.2 /100 | #80 | Exceptional 5.0% |
| French | 96.2 /100 | #81 | Exceptional 5.0% |
| Chileans | 96.2 /100 | #82 | Exceptional 5.0% |
| Immigrants | Eritrea | 96.0 /100 | #83 | Exceptional 5.0% |
| Serbians | 95.7 /100 | #84 | Exceptional 5.1% |
Demographics Similar to Puget Sound Salish by Male Unemployment
In terms of male unemployment, the demographic groups most similar to Puget Sound Salish are Ugandan (5.5%, a difference of 0.17%), Samoan (5.5%, a difference of 0.20%), Hmong (5.5%, a difference of 0.33%), Immigrants (5.5%, a difference of 0.37%), and Delaware (5.5%, a difference of 0.42%).
| Demographics | Rating | Rank | Male Unemployment |
| Immigrants | Syria | 9.3 /100 | #207 | Tragic 5.5% |
| Immigrants | Lebanon | 8.6 /100 | #208 | Tragic 5.5% |
| Immigrants | Middle Africa | 8.3 /100 | #209 | Tragic 5.5% |
| South American Indians | 7.6 /100 | #210 | Tragic 5.5% |
| Israelis | 7.4 /100 | #211 | Tragic 5.5% |
| Hmong | 7.0 /100 | #212 | Tragic 5.5% |
| Ugandans | 6.3 /100 | #213 | Tragic 5.5% |
| Puget Sound Salish | 5.6 /100 | #214 | Tragic 5.5% |
| Samoans | 4.9 /100 | #215 | Tragic 5.5% |
| Immigrants | Immigrants | 4.3 /100 | #216 | Tragic 5.5% |
| Delaware | 4.2 /100 | #217 | Tragic 5.5% |
| Immigrants | Albania | 3.6 /100 | #218 | Tragic 5.5% |
| Immigrants | Western Asia | 3.5 /100 | #219 | Tragic 5.6% |
| Portuguese | 3.5 /100 | #220 | Tragic 5.6% |
| Soviet Union | 3.2 /100 | #221 | Tragic 5.6% |