Alaska Native vs Puget Sound Salish Male Unemployment
COMPARE
Alaska Native
Puget Sound Salish
Male Unemployment
Male Unemployment Comparison
Alaska Natives
Puget Sound Salish
8.1%
MALE UNEMPLOYMENT
0.0/ 100
METRIC RATING
331st/ 347
METRIC RANK
5.5%
MALE UNEMPLOYMENT
5.6/ 100
METRIC RATING
214th/ 347
METRIC RANK
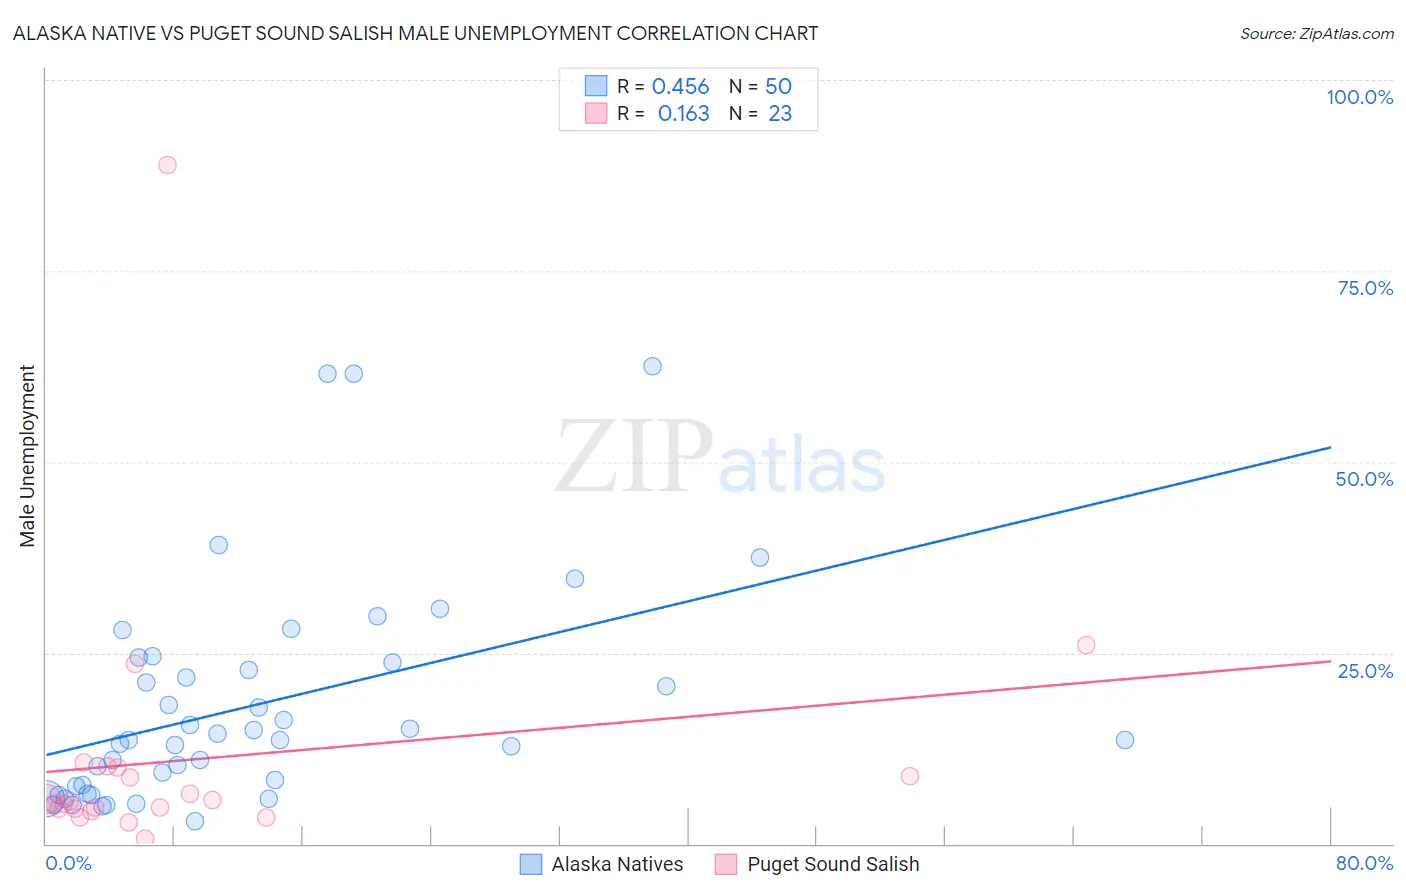
Alaska Native vs Puget Sound Salish Male Unemployment Correlation Chart
The statistical analysis conducted on geographies consisting of 76,676,462 people shows a moderate positive correlation between the proportion of Alaska Natives and unemployment rate among males in the United States with a correlation coefficient (R) of 0.456 and weighted average of 8.1%. Similarly, the statistical analysis conducted on geographies consisting of 46,067,216 people shows a poor positive correlation between the proportion of Puget Sound Salish and unemployment rate among males in the United States with a correlation coefficient (R) of 0.163 and weighted average of 5.5%, a difference of 46.5%.
Male Unemployment Correlation Summary
| Measurement | Alaska Native | Puget Sound Salish |
| Minimum | 3.0% | 0.60% |
| Maximum | 62.5% | 88.9% |
| Range | 59.5% | 88.3% |
| Mean | 18.1% | 11.1% |
| Median | 13.6% | 5.5% |
| Interquartile 25% (IQ1) | 7.5% | 4.6% |
| Interquartile 75% (IQ3) | 23.7% | 10.0% |
| Interquartile Range (IQR) | 16.2% | 5.4% |
| Standard Deviation (Sample) | 14.4% | 18.0% |
| Standard Deviation (Population) | 14.3% | 17.6% |
Similar Demographics by Male Unemployment
Demographics Similar to Alaska Natives by Male Unemployment
In terms of male unemployment, the demographic groups most similar to Alaska Natives are Yakama (7.9%, a difference of 1.9%), Pima (8.3%, a difference of 2.4%), Immigrants from Yemen (7.8%, a difference of 3.7%), Sioux (8.4%, a difference of 3.7%), and Native/Alaskan (7.7%, a difference of 4.7%).
| Demographics | Rating | Rank | Male Unemployment |
| Dominicans | 0.0 /100 | #324 | Tragic 7.6% |
| Shoshone | 0.0 /100 | #325 | Tragic 7.6% |
| Immigrants | Dominican Republic | 0.0 /100 | #326 | Tragic 7.6% |
| Paiute | 0.0 /100 | #327 | Tragic 7.7% |
| Natives/Alaskans | 0.0 /100 | #328 | Tragic 7.7% |
| Immigrants | Yemen | 0.0 /100 | #329 | Tragic 7.8% |
| Yakama | 0.0 /100 | #330 | Tragic 7.9% |
| Alaska Natives | 0.0 /100 | #331 | Tragic 8.1% |
| Pima | 0.0 /100 | #332 | Tragic 8.3% |
| Sioux | 0.0 /100 | #333 | Tragic 8.4% |
| Tsimshian | 0.0 /100 | #334 | Tragic 8.5% |
| Pueblo | 0.0 /100 | #335 | Tragic 8.5% |
| Yuman | 0.0 /100 | #336 | Tragic 8.6% |
| Puerto Ricans | 0.0 /100 | #337 | Tragic 8.6% |
| Apache | 0.0 /100 | #338 | Tragic 8.6% |
Demographics Similar to Puget Sound Salish by Male Unemployment
In terms of male unemployment, the demographic groups most similar to Puget Sound Salish are Ugandan (5.5%, a difference of 0.17%), Samoan (5.5%, a difference of 0.20%), Hmong (5.5%, a difference of 0.33%), Immigrants (5.5%, a difference of 0.37%), and Delaware (5.5%, a difference of 0.42%).
| Demographics | Rating | Rank | Male Unemployment |
| Immigrants | Syria | 9.3 /100 | #207 | Tragic 5.5% |
| Immigrants | Lebanon | 8.6 /100 | #208 | Tragic 5.5% |
| Immigrants | Middle Africa | 8.3 /100 | #209 | Tragic 5.5% |
| South American Indians | 7.6 /100 | #210 | Tragic 5.5% |
| Israelis | 7.4 /100 | #211 | Tragic 5.5% |
| Hmong | 7.0 /100 | #212 | Tragic 5.5% |
| Ugandans | 6.3 /100 | #213 | Tragic 5.5% |
| Puget Sound Salish | 5.6 /100 | #214 | Tragic 5.5% |
| Samoans | 4.9 /100 | #215 | Tragic 5.5% |
| Immigrants | Immigrants | 4.3 /100 | #216 | Tragic 5.5% |
| Delaware | 4.2 /100 | #217 | Tragic 5.5% |
| Immigrants | Albania | 3.6 /100 | #218 | Tragic 5.5% |
| Immigrants | Western Asia | 3.5 /100 | #219 | Tragic 5.6% |
| Portuguese | 3.5 /100 | #220 | Tragic 5.6% |
| Soviet Union | 3.2 /100 | #221 | Tragic 5.6% |