Sudanese vs U.S. Virgin Islander Male Unemployment
COMPARE
Sudanese
U.S. Virgin Islander
Male Unemployment
Male Unemployment Comparison
Sudanese
U.S. Virgin Islanders
4.8%
MALE UNEMPLOYMENT
99.8/ 100
METRIC RATING
31st/ 347
METRIC RANK
6.4%
MALE UNEMPLOYMENT
0.0/ 100
METRIC RATING
290th/ 347
METRIC RANK
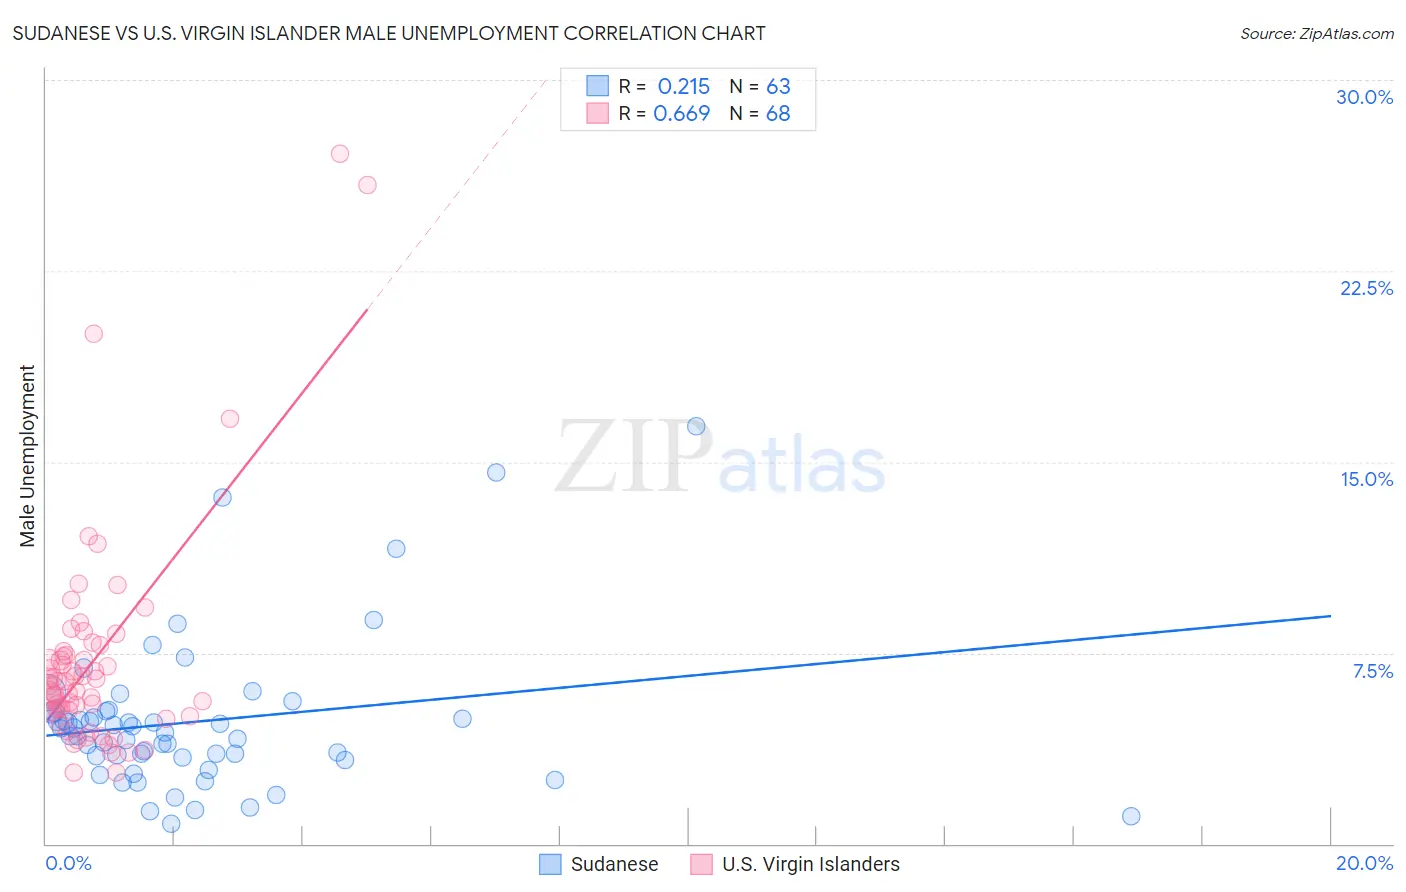
Sudanese vs U.S. Virgin Islander Male Unemployment Correlation Chart
The statistical analysis conducted on geographies consisting of 110,013,962 people shows a weak positive correlation between the proportion of Sudanese and unemployment rate among males in the United States with a correlation coefficient (R) of 0.215 and weighted average of 4.8%. Similarly, the statistical analysis conducted on geographies consisting of 87,502,390 people shows a significant positive correlation between the proportion of U.S. Virgin Islanders and unemployment rate among males in the United States with a correlation coefficient (R) of 0.669 and weighted average of 6.4%, a difference of 32.1%.
Male Unemployment Correlation Summary
| Measurement | Sudanese | U.S. Virgin Islander |
| Minimum | 0.80% | 2.8% |
| Maximum | 16.4% | 27.1% |
| Range | 15.6% | 24.3% |
| Mean | 4.8% | 7.2% |
| Median | 4.4% | 6.3% |
| Interquartile 25% (IQ1) | 3.4% | 5.2% |
| Interquartile 75% (IQ3) | 5.2% | 7.5% |
| Interquartile Range (IQR) | 1.8% | 2.3% |
| Standard Deviation (Sample) | 3.0% | 4.4% |
| Standard Deviation (Population) | 2.9% | 4.4% |
Similar Demographics by Male Unemployment
Demographics Similar to Sudanese by Male Unemployment
In terms of male unemployment, the demographic groups most similar to Sudanese are Immigrants from Nepal (4.8%, a difference of 0.010%), British (4.8%, a difference of 0.25%), Latvian (4.8%, a difference of 0.31%), Welsh (4.8%, a difference of 0.40%), and Scottish (4.8%, a difference of 0.56%).
| Demographics | Rating | Rank | Male Unemployment |
| Immigrants | South Central Asia | 99.9 /100 | #24 | Exceptional 4.8% |
| Zimbabweans | 99.9 /100 | #25 | Exceptional 4.8% |
| Dutch | 99.9 /100 | #26 | Exceptional 4.8% |
| Belgians | 99.9 /100 | #27 | Exceptional 4.8% |
| Bulgarians | 99.8 /100 | #28 | Exceptional 4.8% |
| Scottish | 99.8 /100 | #29 | Exceptional 4.8% |
| British | 99.8 /100 | #30 | Exceptional 4.8% |
| Sudanese | 99.8 /100 | #31 | Exceptional 4.8% |
| Immigrants | Nepal | 99.8 /100 | #32 | Exceptional 4.8% |
| Latvians | 99.7 /100 | #33 | Exceptional 4.8% |
| Welsh | 99.7 /100 | #34 | Exceptional 4.8% |
| Paraguayans | 99.5 /100 | #35 | Exceptional 4.9% |
| Immigrants | Singapore | 99.4 /100 | #36 | Exceptional 4.9% |
| Scotch-Irish | 99.4 /100 | #37 | Exceptional 4.9% |
| Immigrants | Bosnia and Herzegovina | 99.4 /100 | #38 | Exceptional 4.9% |
Demographics Similar to U.S. Virgin Islanders by Male Unemployment
In terms of male unemployment, the demographic groups most similar to U.S. Virgin Islanders are Immigrants from the Azores (6.4%, a difference of 0.52%), Nepalese (6.4%, a difference of 0.87%), Haitian (6.4%, a difference of 0.90%), Senegalese (6.4%, a difference of 1.0%), and Immigrants from Caribbean (6.3%, a difference of 1.6%).
| Demographics | Rating | Rank | Male Unemployment |
| Immigrants | Western Africa | 0.0 /100 | #283 | Tragic 6.2% |
| Spanish American Indians | 0.0 /100 | #284 | Tragic 6.2% |
| Immigrants | Ecuador | 0.0 /100 | #285 | Tragic 6.2% |
| Africans | 0.0 /100 | #286 | Tragic 6.3% |
| Central American Indians | 0.0 /100 | #287 | Tragic 6.3% |
| Immigrants | Senegal | 0.0 /100 | #288 | Tragic 6.3% |
| Immigrants | Caribbean | 0.0 /100 | #289 | Tragic 6.3% |
| U.S. Virgin Islanders | 0.0 /100 | #290 | Tragic 6.4% |
| Immigrants | Azores | 0.0 /100 | #291 | Tragic 6.4% |
| Nepalese | 0.0 /100 | #292 | Tragic 6.4% |
| Haitians | 0.0 /100 | #293 | Tragic 6.4% |
| Senegalese | 0.0 /100 | #294 | Tragic 6.4% |
| Belizeans | 0.0 /100 | #295 | Tragic 6.5% |
| Immigrants | Haiti | 0.0 /100 | #296 | Tragic 6.5% |
| Chippewa | 0.0 /100 | #297 | Tragic 6.6% |