Sudanese vs Seminole Male Unemployment
COMPARE
Sudanese
Seminole
Male Unemployment
Male Unemployment Comparison
Sudanese
Seminole
4.8%
MALE UNEMPLOYMENT
99.8/ 100
METRIC RATING
31st/ 347
METRIC RANK
5.6%
MALE UNEMPLOYMENT
1.8/ 100
METRIC RATING
228th/ 347
METRIC RANK
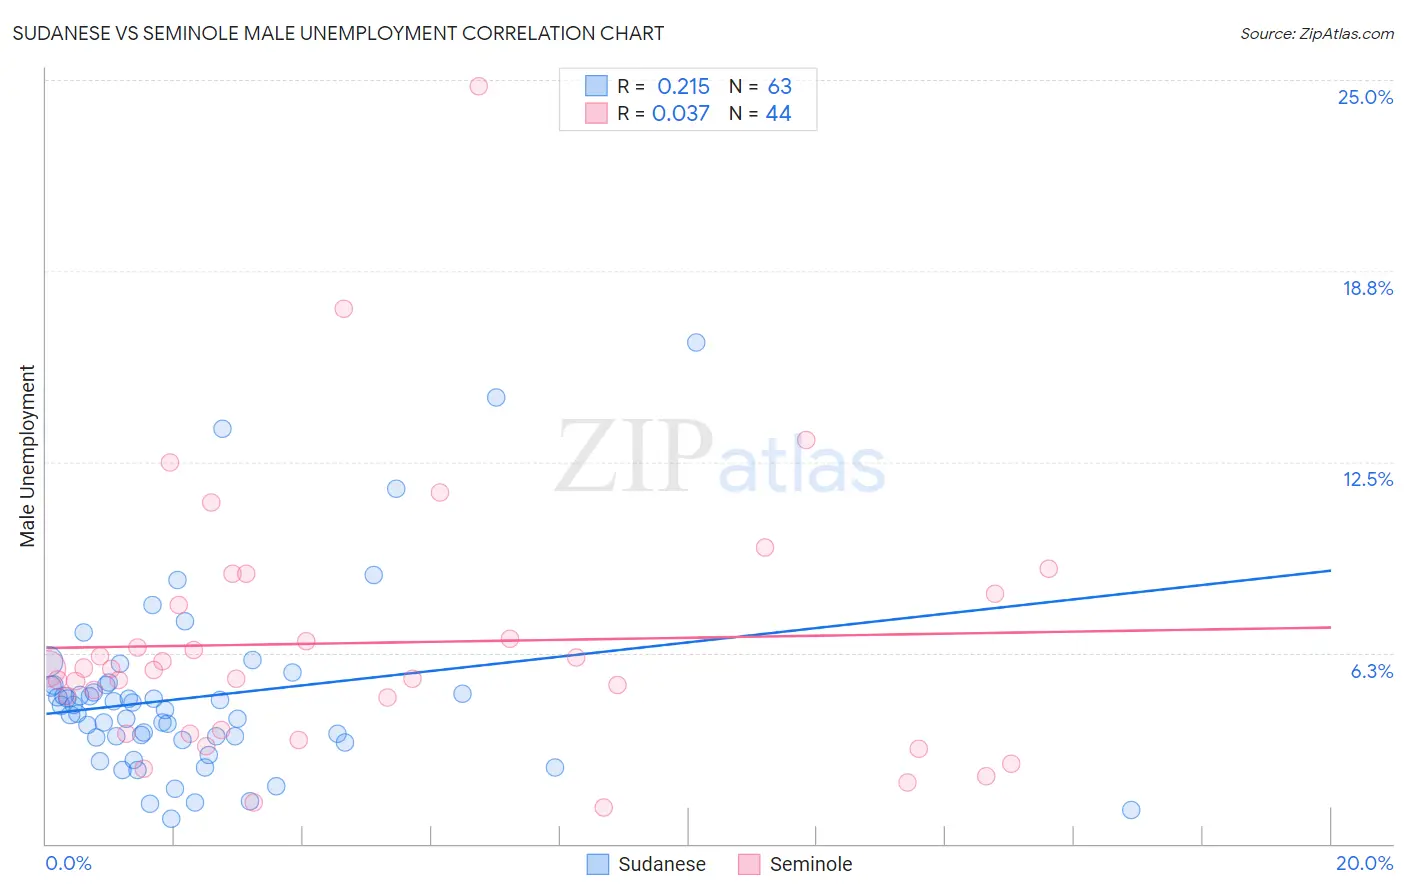
Sudanese vs Seminole Male Unemployment Correlation Chart
The statistical analysis conducted on geographies consisting of 110,013,962 people shows a weak positive correlation between the proportion of Sudanese and unemployment rate among males in the United States with a correlation coefficient (R) of 0.215 and weighted average of 4.8%. Similarly, the statistical analysis conducted on geographies consisting of 118,187,100 people shows no correlation between the proportion of Seminole and unemployment rate among males in the United States with a correlation coefficient (R) of 0.037 and weighted average of 5.6%, a difference of 16.1%.
Male Unemployment Correlation Summary
| Measurement | Sudanese | Seminole |
| Minimum | 0.80% | 1.2% |
| Maximum | 16.4% | 24.8% |
| Range | 15.6% | 23.6% |
| Mean | 4.8% | 6.6% |
| Median | 4.4% | 5.7% |
| Interquartile 25% (IQ1) | 3.4% | 3.7% |
| Interquartile 75% (IQ3) | 5.2% | 8.0% |
| Interquartile Range (IQR) | 1.8% | 4.3% |
| Standard Deviation (Sample) | 3.0% | 4.4% |
| Standard Deviation (Population) | 2.9% | 4.3% |
Similar Demographics by Male Unemployment
Demographics Similar to Sudanese by Male Unemployment
In terms of male unemployment, the demographic groups most similar to Sudanese are Immigrants from Nepal (4.8%, a difference of 0.010%), British (4.8%, a difference of 0.25%), Latvian (4.8%, a difference of 0.31%), Welsh (4.8%, a difference of 0.40%), and Scottish (4.8%, a difference of 0.56%).
| Demographics | Rating | Rank | Male Unemployment |
| Immigrants | South Central Asia | 99.9 /100 | #24 | Exceptional 4.8% |
| Zimbabweans | 99.9 /100 | #25 | Exceptional 4.8% |
| Dutch | 99.9 /100 | #26 | Exceptional 4.8% |
| Belgians | 99.9 /100 | #27 | Exceptional 4.8% |
| Bulgarians | 99.8 /100 | #28 | Exceptional 4.8% |
| Scottish | 99.8 /100 | #29 | Exceptional 4.8% |
| British | 99.8 /100 | #30 | Exceptional 4.8% |
| Sudanese | 99.8 /100 | #31 | Exceptional 4.8% |
| Immigrants | Nepal | 99.8 /100 | #32 | Exceptional 4.8% |
| Latvians | 99.7 /100 | #33 | Exceptional 4.8% |
| Welsh | 99.7 /100 | #34 | Exceptional 4.8% |
| Paraguayans | 99.5 /100 | #35 | Exceptional 4.9% |
| Immigrants | Singapore | 99.4 /100 | #36 | Exceptional 4.9% |
| Scotch-Irish | 99.4 /100 | #37 | Exceptional 4.9% |
| Immigrants | Bosnia and Herzegovina | 99.4 /100 | #38 | Exceptional 4.9% |
Demographics Similar to Seminole by Male Unemployment
In terms of male unemployment, the demographic groups most similar to Seminole are Central American (5.6%, a difference of 0.0%), Immigrants from Cambodia (5.6%, a difference of 0.020%), Immigrants from Panama (5.6%, a difference of 0.020%), Immigrants from Africa (5.6%, a difference of 0.040%), and Choctaw (5.6%, a difference of 0.10%).
| Demographics | Rating | Rank | Male Unemployment |
| Soviet Union | 3.2 /100 | #221 | Tragic 5.6% |
| Immigrants | Micronesia | 2.9 /100 | #222 | Tragic 5.6% |
| Creek | 2.6 /100 | #223 | Tragic 5.6% |
| Cherokee | 2.4 /100 | #224 | Tragic 5.6% |
| Panamanians | 1.9 /100 | #225 | Tragic 5.6% |
| Immigrants | Cambodia | 1.8 /100 | #226 | Tragic 5.6% |
| Immigrants | Panama | 1.8 /100 | #227 | Tragic 5.6% |
| Seminole | 1.8 /100 | #228 | Tragic 5.6% |
| Central Americans | 1.8 /100 | #229 | Tragic 5.6% |
| Immigrants | Africa | 1.7 /100 | #230 | Tragic 5.6% |
| Choctaw | 1.6 /100 | #231 | Tragic 5.6% |
| Moroccans | 1.6 /100 | #232 | Tragic 5.6% |
| Somalis | 1.5 /100 | #233 | Tragic 5.6% |
| Immigrants | Somalia | 1.5 /100 | #234 | Tragic 5.6% |
| Immigrants | Honduras | 1.5 /100 | #235 | Tragic 5.6% |