Okinawan vs Puget Sound Salish Male Unemployment
COMPARE
Okinawan
Puget Sound Salish
Male Unemployment
Male Unemployment Comparison
Okinawans
Puget Sound Salish
5.1%
MALE UNEMPLOYMENT
94.7/ 100
METRIC RATING
90th/ 347
METRIC RANK
5.5%
MALE UNEMPLOYMENT
5.6/ 100
METRIC RATING
214th/ 347
METRIC RANK
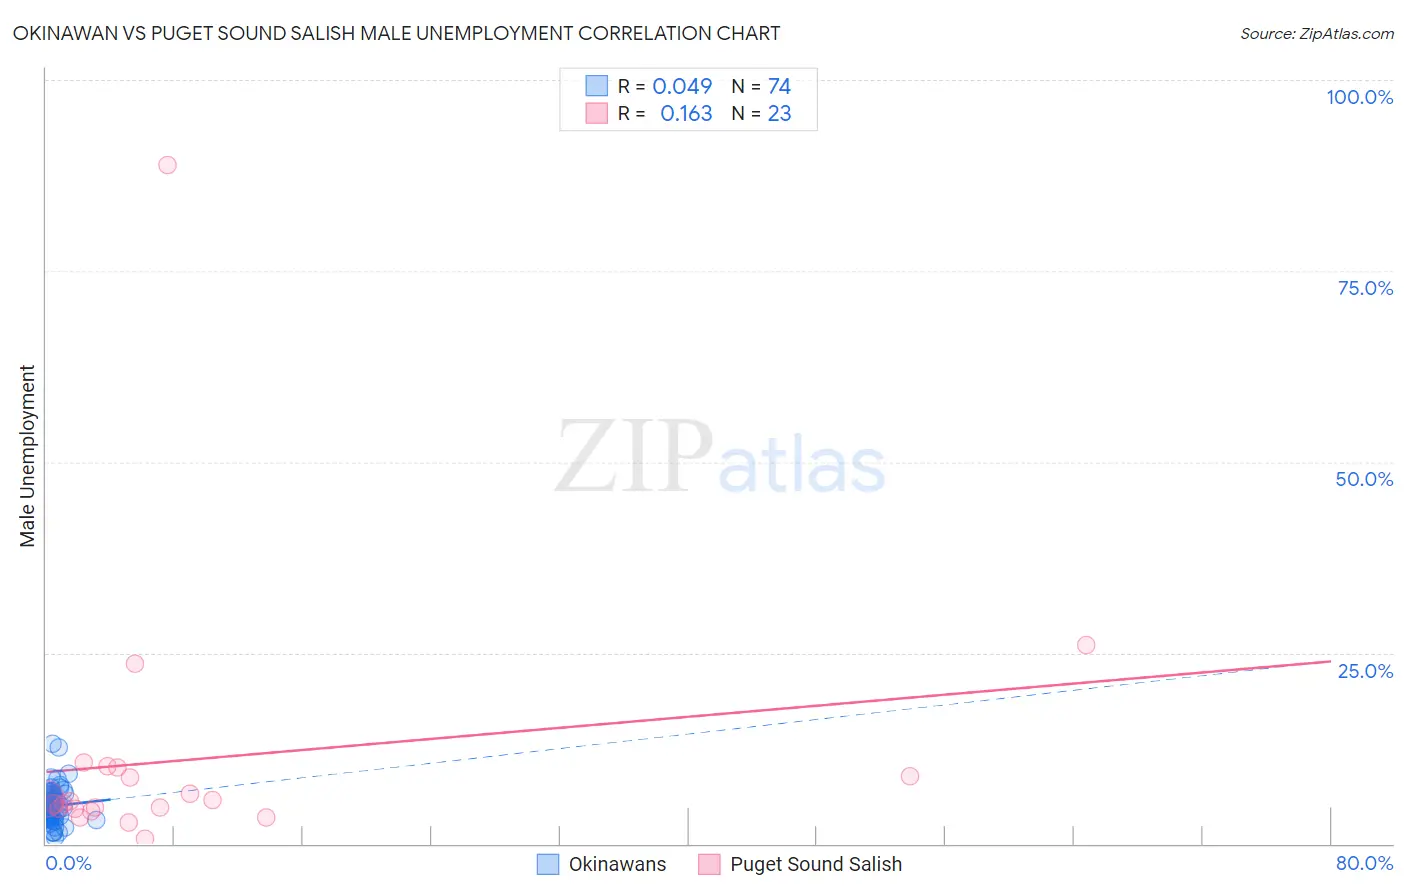
Okinawan vs Puget Sound Salish Male Unemployment Correlation Chart
The statistical analysis conducted on geographies consisting of 73,756,692 people shows no correlation between the proportion of Okinawans and unemployment rate among males in the United States with a correlation coefficient (R) of 0.049 and weighted average of 5.1%. Similarly, the statistical analysis conducted on geographies consisting of 46,067,216 people shows a poor positive correlation between the proportion of Puget Sound Salish and unemployment rate among males in the United States with a correlation coefficient (R) of 0.163 and weighted average of 5.5%, a difference of 8.7%.
Male Unemployment Correlation Summary
| Measurement | Okinawan | Puget Sound Salish |
| Minimum | 0.90% | 0.60% |
| Maximum | 13.1% | 88.9% |
| Range | 12.2% | 88.3% |
| Mean | 4.9% | 11.1% |
| Median | 4.7% | 5.5% |
| Interquartile 25% (IQ1) | 3.6% | 4.6% |
| Interquartile 75% (IQ3) | 5.9% | 10.0% |
| Interquartile Range (IQR) | 2.3% | 5.4% |
| Standard Deviation (Sample) | 2.2% | 18.0% |
| Standard Deviation (Population) | 2.2% | 17.6% |
Similar Demographics by Male Unemployment
Demographics Similar to Okinawans by Male Unemployment
In terms of male unemployment, the demographic groups most similar to Okinawans are Immigrants from Australia (5.1%, a difference of 0.010%), Immigrants from Sri Lanka (5.1%, a difference of 0.040%), Immigrants from Turkey (5.1%, a difference of 0.080%), Slavic (5.1%, a difference of 0.14%), and Immigrants from Serbia (5.1%, a difference of 0.14%).
| Demographics | Rating | Rank | Male Unemployment |
| Immigrants | Eritrea | 96.0 /100 | #83 | Exceptional 5.0% |
| Serbians | 95.7 /100 | #84 | Exceptional 5.1% |
| Immigrants | North Macedonia | 95.6 /100 | #85 | Exceptional 5.1% |
| Maltese | 95.5 /100 | #86 | Exceptional 5.1% |
| Immigrants | Romania | 95.4 /100 | #87 | Exceptional 5.1% |
| Immigrants | Sri Lanka | 94.9 /100 | #88 | Exceptional 5.1% |
| Immigrants | Australia | 94.7 /100 | #89 | Exceptional 5.1% |
| Okinawans | 94.7 /100 | #90 | Exceptional 5.1% |
| Immigrants | Turkey | 94.4 /100 | #91 | Exceptional 5.1% |
| Slavs | 94.2 /100 | #92 | Exceptional 5.1% |
| Immigrants | Serbia | 94.2 /100 | #93 | Exceptional 5.1% |
| Canadians | 94.1 /100 | #94 | Exceptional 5.1% |
| Italians | 93.8 /100 | #95 | Exceptional 5.1% |
| Asians | 93.7 /100 | #96 | Exceptional 5.1% |
| Immigrants | Spain | 93.4 /100 | #97 | Exceptional 5.1% |
Demographics Similar to Puget Sound Salish by Male Unemployment
In terms of male unemployment, the demographic groups most similar to Puget Sound Salish are Ugandan (5.5%, a difference of 0.17%), Samoan (5.5%, a difference of 0.20%), Hmong (5.5%, a difference of 0.33%), Immigrants (5.5%, a difference of 0.37%), and Delaware (5.5%, a difference of 0.42%).
| Demographics | Rating | Rank | Male Unemployment |
| Immigrants | Syria | 9.3 /100 | #207 | Tragic 5.5% |
| Immigrants | Lebanon | 8.6 /100 | #208 | Tragic 5.5% |
| Immigrants | Middle Africa | 8.3 /100 | #209 | Tragic 5.5% |
| South American Indians | 7.6 /100 | #210 | Tragic 5.5% |
| Israelis | 7.4 /100 | #211 | Tragic 5.5% |
| Hmong | 7.0 /100 | #212 | Tragic 5.5% |
| Ugandans | 6.3 /100 | #213 | Tragic 5.5% |
| Puget Sound Salish | 5.6 /100 | #214 | Tragic 5.5% |
| Samoans | 4.9 /100 | #215 | Tragic 5.5% |
| Immigrants | Immigrants | 4.3 /100 | #216 | Tragic 5.5% |
| Delaware | 4.2 /100 | #217 | Tragic 5.5% |
| Immigrants | Albania | 3.6 /100 | #218 | Tragic 5.5% |
| Immigrants | Western Asia | 3.5 /100 | #219 | Tragic 5.6% |
| Portuguese | 3.5 /100 | #220 | Tragic 5.6% |
| Soviet Union | 3.2 /100 | #221 | Tragic 5.6% |