Sudanese vs Immigrants from Portugal Male Unemployment
COMPARE
Sudanese
Immigrants from Portugal
Male Unemployment
Male Unemployment Comparison
Sudanese
Immigrants from Portugal
4.8%
MALE UNEMPLOYMENT
99.8/ 100
METRIC RATING
31st/ 347
METRIC RANK
5.9%
MALE UNEMPLOYMENT
0.1/ 100
METRIC RATING
262nd/ 347
METRIC RANK
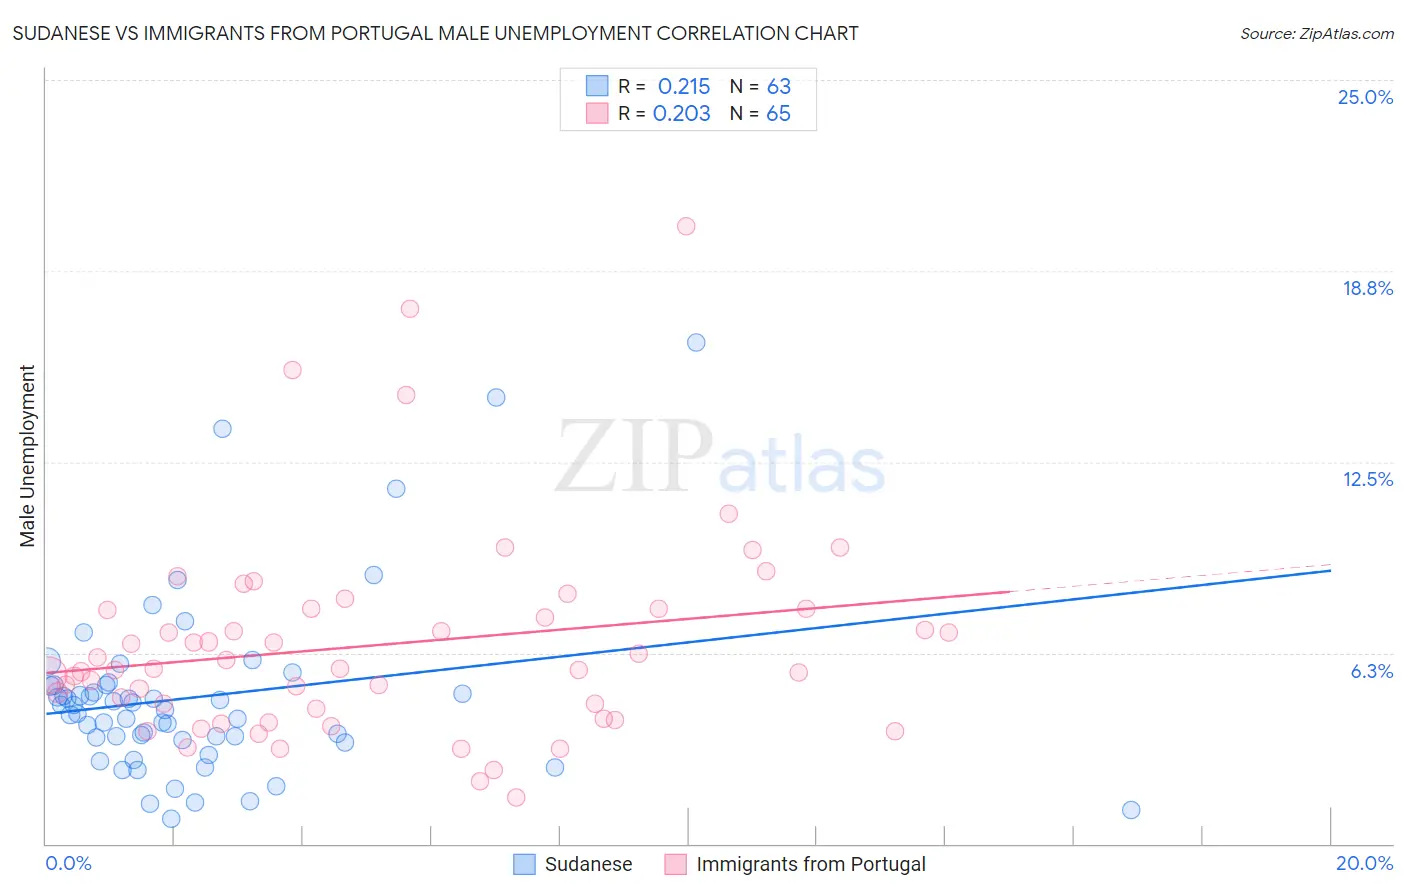
Sudanese vs Immigrants from Portugal Male Unemployment Correlation Chart
The statistical analysis conducted on geographies consisting of 110,013,962 people shows a weak positive correlation between the proportion of Sudanese and unemployment rate among males in the United States with a correlation coefficient (R) of 0.215 and weighted average of 4.8%. Similarly, the statistical analysis conducted on geographies consisting of 174,523,073 people shows a weak positive correlation between the proportion of Immigrants from Portugal and unemployment rate among males in the United States with a correlation coefficient (R) of 0.203 and weighted average of 5.9%, a difference of 21.3%.
Male Unemployment Correlation Summary
| Measurement | Sudanese | Immigrants from Portugal |
| Minimum | 0.80% | 1.5% |
| Maximum | 16.4% | 20.2% |
| Range | 15.6% | 18.7% |
| Mean | 4.8% | 6.5% |
| Median | 4.4% | 5.7% |
| Interquartile 25% (IQ1) | 3.4% | 4.2% |
| Interquartile 75% (IQ3) | 5.2% | 7.7% |
| Interquartile Range (IQR) | 1.8% | 3.4% |
| Standard Deviation (Sample) | 3.0% | 3.4% |
| Standard Deviation (Population) | 2.9% | 3.4% |
Similar Demographics by Male Unemployment
Demographics Similar to Sudanese by Male Unemployment
In terms of male unemployment, the demographic groups most similar to Sudanese are Immigrants from Nepal (4.8%, a difference of 0.010%), British (4.8%, a difference of 0.25%), Latvian (4.8%, a difference of 0.31%), Welsh (4.8%, a difference of 0.40%), and Scottish (4.8%, a difference of 0.56%).
| Demographics | Rating | Rank | Male Unemployment |
| Immigrants | South Central Asia | 99.9 /100 | #24 | Exceptional 4.8% |
| Zimbabweans | 99.9 /100 | #25 | Exceptional 4.8% |
| Dutch | 99.9 /100 | #26 | Exceptional 4.8% |
| Belgians | 99.9 /100 | #27 | Exceptional 4.8% |
| Bulgarians | 99.8 /100 | #28 | Exceptional 4.8% |
| Scottish | 99.8 /100 | #29 | Exceptional 4.8% |
| British | 99.8 /100 | #30 | Exceptional 4.8% |
| Sudanese | 99.8 /100 | #31 | Exceptional 4.8% |
| Immigrants | Nepal | 99.8 /100 | #32 | Exceptional 4.8% |
| Latvians | 99.7 /100 | #33 | Exceptional 4.8% |
| Welsh | 99.7 /100 | #34 | Exceptional 4.8% |
| Paraguayans | 99.5 /100 | #35 | Exceptional 4.9% |
| Immigrants | Singapore | 99.4 /100 | #36 | Exceptional 4.9% |
| Scotch-Irish | 99.4 /100 | #37 | Exceptional 4.9% |
| Immigrants | Bosnia and Herzegovina | 99.4 /100 | #38 | Exceptional 4.9% |
Demographics Similar to Immigrants from Portugal by Male Unemployment
In terms of male unemployment, the demographic groups most similar to Immigrants from Portugal are Immigrants from Latin America (5.9%, a difference of 0.24%), Liberian (5.8%, a difference of 0.45%), Immigrants from Mexico (5.9%, a difference of 0.46%), Immigrants from Central America (5.8%, a difference of 0.63%), and Cajun (5.8%, a difference of 0.69%).
| Demographics | Rating | Rank | Male Unemployment |
| Kiowa | 0.2 /100 | #255 | Tragic 5.8% |
| Comanche | 0.2 /100 | #256 | Tragic 5.8% |
| Hispanics or Latinos | 0.1 /100 | #257 | Tragic 5.8% |
| Dutch West Indians | 0.1 /100 | #258 | Tragic 5.8% |
| Cajuns | 0.1 /100 | #259 | Tragic 5.8% |
| Immigrants | Central America | 0.1 /100 | #260 | Tragic 5.8% |
| Liberians | 0.1 /100 | #261 | Tragic 5.8% |
| Immigrants | Portugal | 0.1 /100 | #262 | Tragic 5.9% |
| Immigrants | Latin America | 0.1 /100 | #263 | Tragic 5.9% |
| Immigrants | Mexico | 0.0 /100 | #264 | Tragic 5.9% |
| French American Indians | 0.0 /100 | #265 | Tragic 5.9% |
| Bahamians | 0.0 /100 | #266 | Tragic 5.9% |
| Nigerians | 0.0 /100 | #267 | Tragic 5.9% |
| Bermudans | 0.0 /100 | #268 | Tragic 5.9% |
| Immigrants | Nigeria | 0.0 /100 | #269 | Tragic 6.0% |