Immigrants from Zaire vs Puget Sound Salish Male Unemployment
COMPARE
Immigrants from Zaire
Puget Sound Salish
Male Unemployment
Male Unemployment Comparison
Immigrants from Zaire
Puget Sound Salish
5.4%
MALE UNEMPLOYMENT
13.7/ 100
METRIC RATING
200th/ 347
METRIC RANK
5.5%
MALE UNEMPLOYMENT
5.6/ 100
METRIC RATING
214th/ 347
METRIC RANK
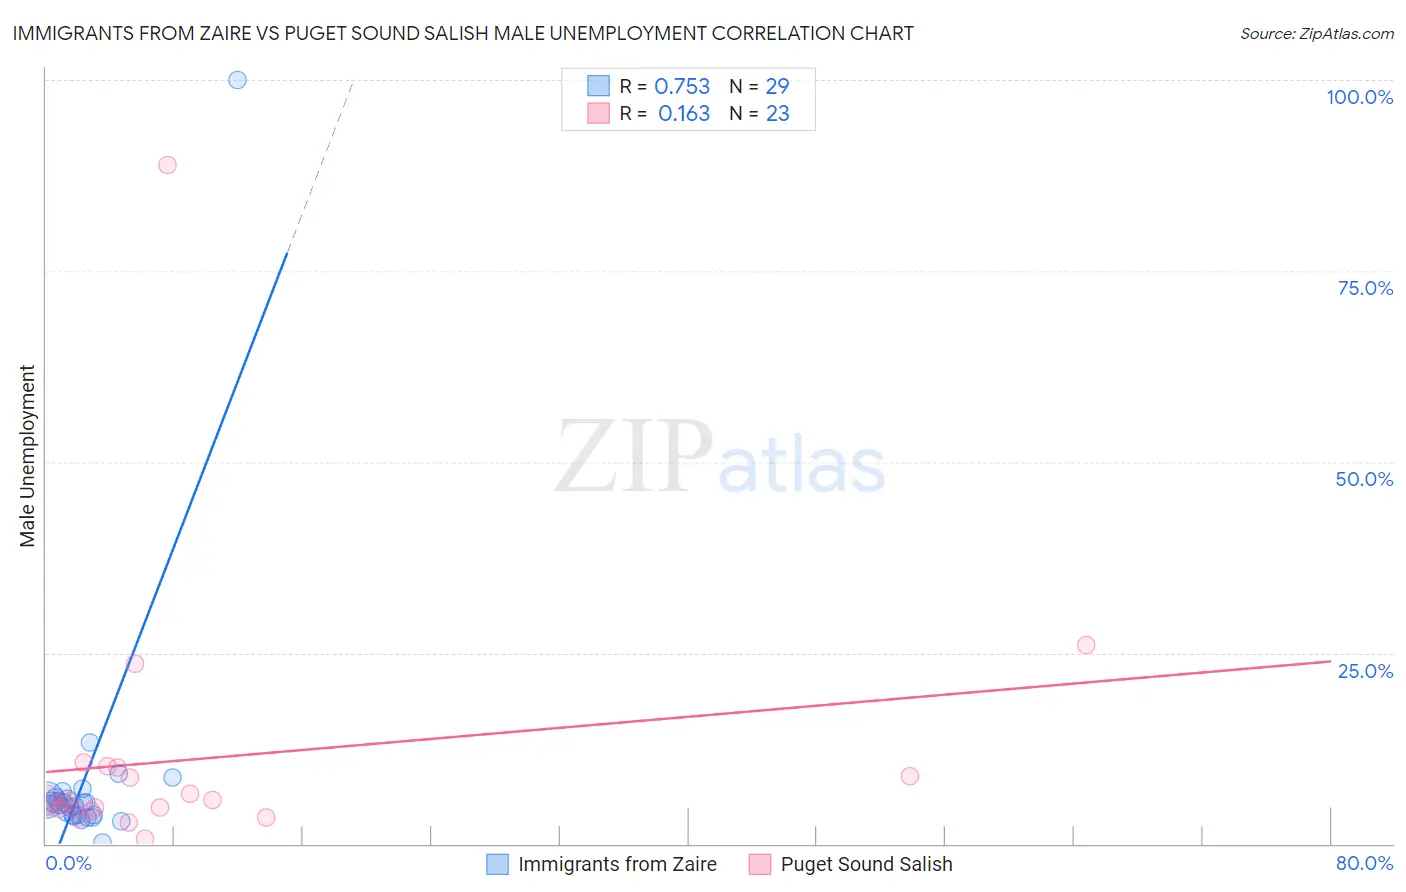
Immigrants from Zaire vs Puget Sound Salish Male Unemployment Correlation Chart
The statistical analysis conducted on geographies consisting of 107,173,070 people shows a strong positive correlation between the proportion of Immigrants from Zaire and unemployment rate among males in the United States with a correlation coefficient (R) of 0.753 and weighted average of 5.4%. Similarly, the statistical analysis conducted on geographies consisting of 46,067,216 people shows a poor positive correlation between the proportion of Puget Sound Salish and unemployment rate among males in the United States with a correlation coefficient (R) of 0.163 and weighted average of 5.5%, a difference of 1.4%.
Male Unemployment Correlation Summary
| Measurement | Immigrants from Zaire | Puget Sound Salish |
| Minimum | 0.20% | 0.60% |
| Maximum | 100.0% | 88.9% |
| Range | 99.8% | 88.3% |
| Mean | 8.5% | 11.1% |
| Median | 5.3% | 5.5% |
| Interquartile 25% (IQ1) | 3.7% | 4.6% |
| Interquartile 75% (IQ3) | 6.0% | 10.0% |
| Interquartile Range (IQR) | 2.3% | 5.4% |
| Standard Deviation (Sample) | 17.7% | 18.0% |
| Standard Deviation (Population) | 17.4% | 17.6% |
Demographics Similar to Immigrants from Zaire and Puget Sound Salish by Male Unemployment
In terms of male unemployment, the demographic groups most similar to Immigrants from Zaire are Immigrants from Philippines (5.4%, a difference of 0.020%), Nonimmigrants (5.4%, a difference of 0.070%), Immigrants from Laos (5.4%, a difference of 0.080%), Immigrants from Greece (5.4%, a difference of 0.10%), and Immigrants from Thailand (5.4%, a difference of 0.12%). Similarly, the demographic groups most similar to Puget Sound Salish are Ugandan (5.5%, a difference of 0.17%), Samoan (5.5%, a difference of 0.20%), Hmong (5.5%, a difference of 0.33%), Immigrants (5.5%, a difference of 0.37%), and Delaware (5.5%, a difference of 0.42%).
| Demographics | Rating | Rank | Male Unemployment |
| Alsatians | 16.7 /100 | #197 | Poor 5.4% |
| Immigrants | Thailand | 14.7 /100 | #198 | Poor 5.4% |
| Immigrants | Greece | 14.5 /100 | #199 | Poor 5.4% |
| Immigrants | Zaire | 13.7 /100 | #200 | Poor 5.4% |
| Immigrants | Philippines | 13.5 /100 | #201 | Poor 5.4% |
| Immigrants | Nonimmigrants | 13.1 /100 | #202 | Poor 5.4% |
| Immigrants | Laos | 13.0 /100 | #203 | Poor 5.4% |
| Guamanians/Chamorros | 12.3 /100 | #204 | Poor 5.4% |
| Immigrants | Costa Rica | 11.4 /100 | #205 | Poor 5.5% |
| Immigrants | Ukraine | 9.9 /100 | #206 | Tragic 5.5% |
| Immigrants | Syria | 9.3 /100 | #207 | Tragic 5.5% |
| Immigrants | Lebanon | 8.6 /100 | #208 | Tragic 5.5% |
| Immigrants | Middle Africa | 8.3 /100 | #209 | Tragic 5.5% |
| South American Indians | 7.6 /100 | #210 | Tragic 5.5% |
| Israelis | 7.4 /100 | #211 | Tragic 5.5% |
| Hmong | 7.0 /100 | #212 | Tragic 5.5% |
| Ugandans | 6.3 /100 | #213 | Tragic 5.5% |
| Puget Sound Salish | 5.6 /100 | #214 | Tragic 5.5% |
| Samoans | 4.9 /100 | #215 | Tragic 5.5% |
| Immigrants | Immigrants | 4.3 /100 | #216 | Tragic 5.5% |
| Delaware | 4.2 /100 | #217 | Tragic 5.5% |