Native/Alaskan vs Subsaharan African Unemployment Among Ages 20 to 24 years
COMPARE
Native/Alaskan
Subsaharan African
Unemployment Among Ages 20 to 24 years
Unemployment Among Ages 20 to 24 years Comparison
Natives/Alaskans
Sub-Saharan Africans
13.0%
UNEMPLOYMENT AMONG AGES 20 TO 24 YEARS
0.0/ 100
METRIC RATING
322nd/ 347
METRIC RANK
11.1%
UNEMPLOYMENT AMONG AGES 20 TO 24 YEARS
0.0/ 100
METRIC RATING
264th/ 347
METRIC RANK
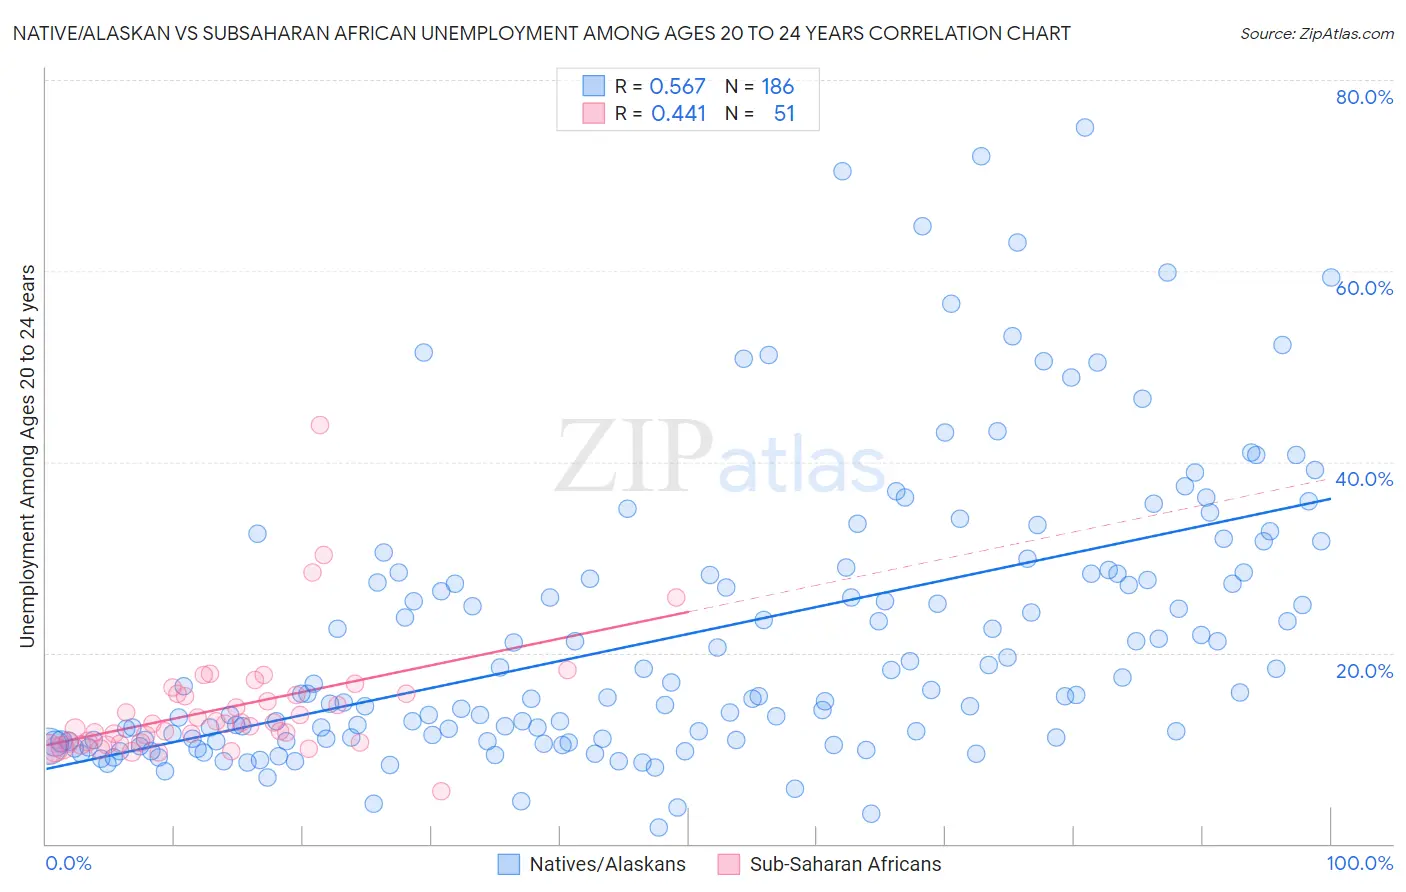
Native/Alaskan vs Subsaharan African Unemployment Among Ages 20 to 24 years Correlation Chart
The statistical analysis conducted on geographies consisting of 484,471,269 people shows a substantial positive correlation between the proportion of Natives/Alaskans and unemployment rate among population between the ages 20 and 24 in the United States with a correlation coefficient (R) of 0.567 and weighted average of 13.0%. Similarly, the statistical analysis conducted on geographies consisting of 484,655,808 people shows a moderate positive correlation between the proportion of Sub-Saharan Africans and unemployment rate among population between the ages 20 and 24 in the United States with a correlation coefficient (R) of 0.441 and weighted average of 11.1%, a difference of 17.5%.
Unemployment Among Ages 20 to 24 years Correlation Summary
| Measurement | Native/Alaskan | Subsaharan African |
| Minimum | 1.8% | 5.5% |
| Maximum | 75.0% | 43.9% |
| Range | 73.2% | 38.4% |
| Mean | 21.9% | 14.2% |
| Median | 15.7% | 12.5% |
| Interquartile 25% (IQ1) | 10.9% | 10.5% |
| Interquartile 75% (IQ3) | 28.3% | 15.7% |
| Interquartile Range (IQR) | 17.5% | 5.2% |
| Standard Deviation (Sample) | 14.8% | 6.3% |
| Standard Deviation (Population) | 14.8% | 6.2% |
Similar Demographics by Unemployment Among Ages 20 to 24 years
Demographics Similar to Natives/Alaskans by Unemployment Among Ages 20 to 24 years
In terms of unemployment among ages 20 to 24 years, the demographic groups most similar to Natives/Alaskans are Immigrants from Jamaica (13.0%, a difference of 0.38%), Cheyenne (13.0%, a difference of 0.47%), Yakama (13.1%, a difference of 0.48%), Trinidadian and Tobagonian (12.9%, a difference of 0.89%), and Barbadian (12.9%, a difference of 1.1%).
| Demographics | Rating | Rank | Unemployment Among Ages 20 to 24 years |
| West Indians | 0.0 /100 | #315 | Tragic 12.8% |
| Immigrants | Dominica | 0.0 /100 | #316 | Tragic 12.8% |
| Immigrants | Trinidad and Tobago | 0.0 /100 | #317 | Tragic 12.8% |
| Barbadians | 0.0 /100 | #318 | Tragic 12.9% |
| Trinidadians and Tobagonians | 0.0 /100 | #319 | Tragic 12.9% |
| Cheyenne | 0.0 /100 | #320 | Tragic 13.0% |
| Immigrants | Jamaica | 0.0 /100 | #321 | Tragic 13.0% |
| Natives/Alaskans | 0.0 /100 | #322 | Tragic 13.0% |
| Yakama | 0.0 /100 | #323 | Tragic 13.1% |
| Alaska Natives | 0.0 /100 | #324 | Tragic 13.2% |
| Pueblo | 0.0 /100 | #325 | Tragic 13.2% |
| Immigrants | Barbados | 0.0 /100 | #326 | Tragic 13.5% |
| Immigrants | Dominican Republic | 0.0 /100 | #327 | Tragic 13.6% |
| British West Indians | 0.0 /100 | #328 | Tragic 13.7% |
| Dominicans | 0.0 /100 | #329 | Tragic 13.8% |
Demographics Similar to Sub-Saharan Africans by Unemployment Among Ages 20 to 24 years
In terms of unemployment among ages 20 to 24 years, the demographic groups most similar to Sub-Saharan Africans are Immigrants from Ireland (11.1%, a difference of 0.070%), Immigrants from Liberia (11.1%, a difference of 0.16%), Immigrants from Greece (11.1%, a difference of 0.44%), Marshallese (11.0%, a difference of 0.75%), and Maltese (11.2%, a difference of 0.89%).
| Demographics | Rating | Rank | Unemployment Among Ages 20 to 24 years |
| Immigrants | Western Asia | 0.3 /100 | #257 | Tragic 10.9% |
| Dutch West Indians | 0.3 /100 | #258 | Tragic 10.9% |
| Panamanians | 0.2 /100 | #259 | Tragic 10.9% |
| Immigrants | Lebanon | 0.2 /100 | #260 | Tragic 10.9% |
| Puget Sound Salish | 0.2 /100 | #261 | Tragic 10.9% |
| Immigrants | Latin America | 0.1 /100 | #262 | Tragic 11.0% |
| Marshallese | 0.1 /100 | #263 | Tragic 11.0% |
| Sub-Saharan Africans | 0.0 /100 | #264 | Tragic 11.1% |
| Immigrants | Ireland | 0.0 /100 | #265 | Tragic 11.1% |
| Immigrants | Liberia | 0.0 /100 | #266 | Tragic 11.1% |
| Immigrants | Greece | 0.0 /100 | #267 | Tragic 11.1% |
| Maltese | 0.0 /100 | #268 | Tragic 11.2% |
| Ute | 0.0 /100 | #269 | Tragic 11.2% |
| Delaware | 0.0 /100 | #270 | Tragic 11.3% |
| Immigrants | Uzbekistan | 0.0 /100 | #271 | Tragic 11.4% |