Maltese vs Subsaharan African Unemployment Among Ages 20 to 24 years
COMPARE
Maltese
Subsaharan African
Unemployment Among Ages 20 to 24 years
Unemployment Among Ages 20 to 24 years Comparison
Maltese
Sub-Saharan Africans
11.2%
UNEMPLOYMENT AMONG AGES 20 TO 24 YEARS
0.0/ 100
METRIC RATING
268th/ 347
METRIC RANK
11.1%
UNEMPLOYMENT AMONG AGES 20 TO 24 YEARS
0.0/ 100
METRIC RATING
264th/ 347
METRIC RANK
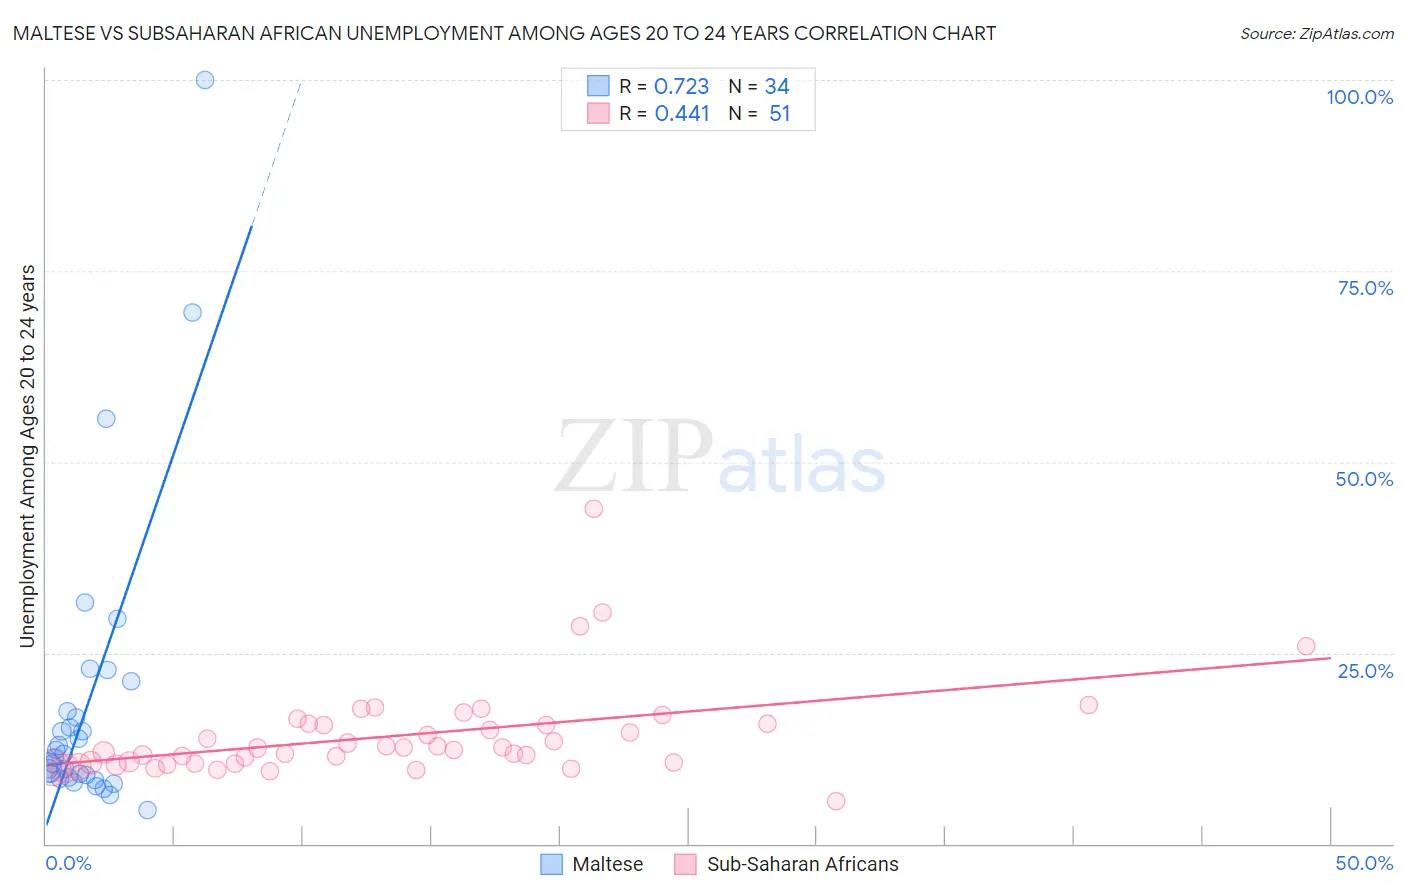
Maltese vs Subsaharan African Unemployment Among Ages 20 to 24 years Correlation Chart
The statistical analysis conducted on geographies consisting of 124,902,800 people shows a strong positive correlation between the proportion of Maltese and unemployment rate among population between the ages 20 and 24 in the United States with a correlation coefficient (R) of 0.723 and weighted average of 11.2%. Similarly, the statistical analysis conducted on geographies consisting of 484,655,808 people shows a moderate positive correlation between the proportion of Sub-Saharan Africans and unemployment rate among population between the ages 20 and 24 in the United States with a correlation coefficient (R) of 0.441 and weighted average of 11.1%, a difference of 0.89%.
Unemployment Among Ages 20 to 24 years Correlation Summary
| Measurement | Maltese | Subsaharan African |
| Minimum | 4.4% | 5.5% |
| Maximum | 100.0% | 43.9% |
| Range | 95.6% | 38.4% |
| Mean | 18.5% | 14.2% |
| Median | 11.5% | 12.5% |
| Interquartile 25% (IQ1) | 8.6% | 10.5% |
| Interquartile 75% (IQ3) | 17.3% | 15.7% |
| Interquartile Range (IQR) | 8.6% | 5.2% |
| Standard Deviation (Sample) | 19.7% | 6.3% |
| Standard Deviation (Population) | 19.4% | 6.2% |
Demographics Similar to Maltese and Sub-Saharan Africans by Unemployment Among Ages 20 to 24 years
In terms of unemployment among ages 20 to 24 years, the demographic groups most similar to Maltese are Ute (11.2%, a difference of 0.39%), Immigrants from Greece (11.1%, a difference of 0.44%), Immigrants from Liberia (11.1%, a difference of 0.72%), Immigrants from Ireland (11.1%, a difference of 0.82%), and Delaware (11.3%, a difference of 0.97%). Similarly, the demographic groups most similar to Sub-Saharan Africans are Immigrants from Ireland (11.1%, a difference of 0.070%), Immigrants from Liberia (11.1%, a difference of 0.16%), Immigrants from Greece (11.1%, a difference of 0.44%), Marshallese (11.0%, a difference of 0.75%), and Immigrants from Latin America (11.0%, a difference of 1.0%).
| Demographics | Rating | Rank | Unemployment Among Ages 20 to 24 years |
| Immigrants | Bahamas | 0.3 /100 | #256 | Tragic 10.9% |
| Immigrants | Western Asia | 0.3 /100 | #257 | Tragic 10.9% |
| Dutch West Indians | 0.3 /100 | #258 | Tragic 10.9% |
| Panamanians | 0.2 /100 | #259 | Tragic 10.9% |
| Immigrants | Lebanon | 0.2 /100 | #260 | Tragic 10.9% |
| Puget Sound Salish | 0.2 /100 | #261 | Tragic 10.9% |
| Immigrants | Latin America | 0.1 /100 | #262 | Tragic 11.0% |
| Marshallese | 0.1 /100 | #263 | Tragic 11.0% |
| Sub-Saharan Africans | 0.0 /100 | #264 | Tragic 11.1% |
| Immigrants | Ireland | 0.0 /100 | #265 | Tragic 11.1% |
| Immigrants | Liberia | 0.0 /100 | #266 | Tragic 11.1% |
| Immigrants | Greece | 0.0 /100 | #267 | Tragic 11.1% |
| Maltese | 0.0 /100 | #268 | Tragic 11.2% |
| Ute | 0.0 /100 | #269 | Tragic 11.2% |
| Delaware | 0.0 /100 | #270 | Tragic 11.3% |
| Immigrants | Uzbekistan | 0.0 /100 | #271 | Tragic 11.4% |
| Nigerians | 0.0 /100 | #272 | Tragic 11.4% |
| Immigrants | Nigeria | 0.0 /100 | #273 | Tragic 11.5% |
| Cape Verdeans | 0.0 /100 | #274 | Tragic 11.5% |
| Senegalese | 0.0 /100 | #275 | Tragic 11.5% |
| Sierra Leoneans | 0.0 /100 | #276 | Tragic 11.5% |