Scotch-Irish vs Immigrants from Latvia Unemployment Among Ages 20 to 24 years
COMPARE
Scotch-Irish
Immigrants from Latvia
Unemployment Among Ages 20 to 24 years
Unemployment Among Ages 20 to 24 years Comparison
Scotch-Irish
Immigrants from Latvia
10.0%
UNEMPLOYMENT AMONG AGES 20 TO 24 YEARS
96.2/ 100
METRIC RATING
95th/ 347
METRIC RANK
10.1%
UNEMPLOYMENT AMONG AGES 20 TO 24 YEARS
93.2/ 100
METRIC RATING
108th/ 347
METRIC RANK
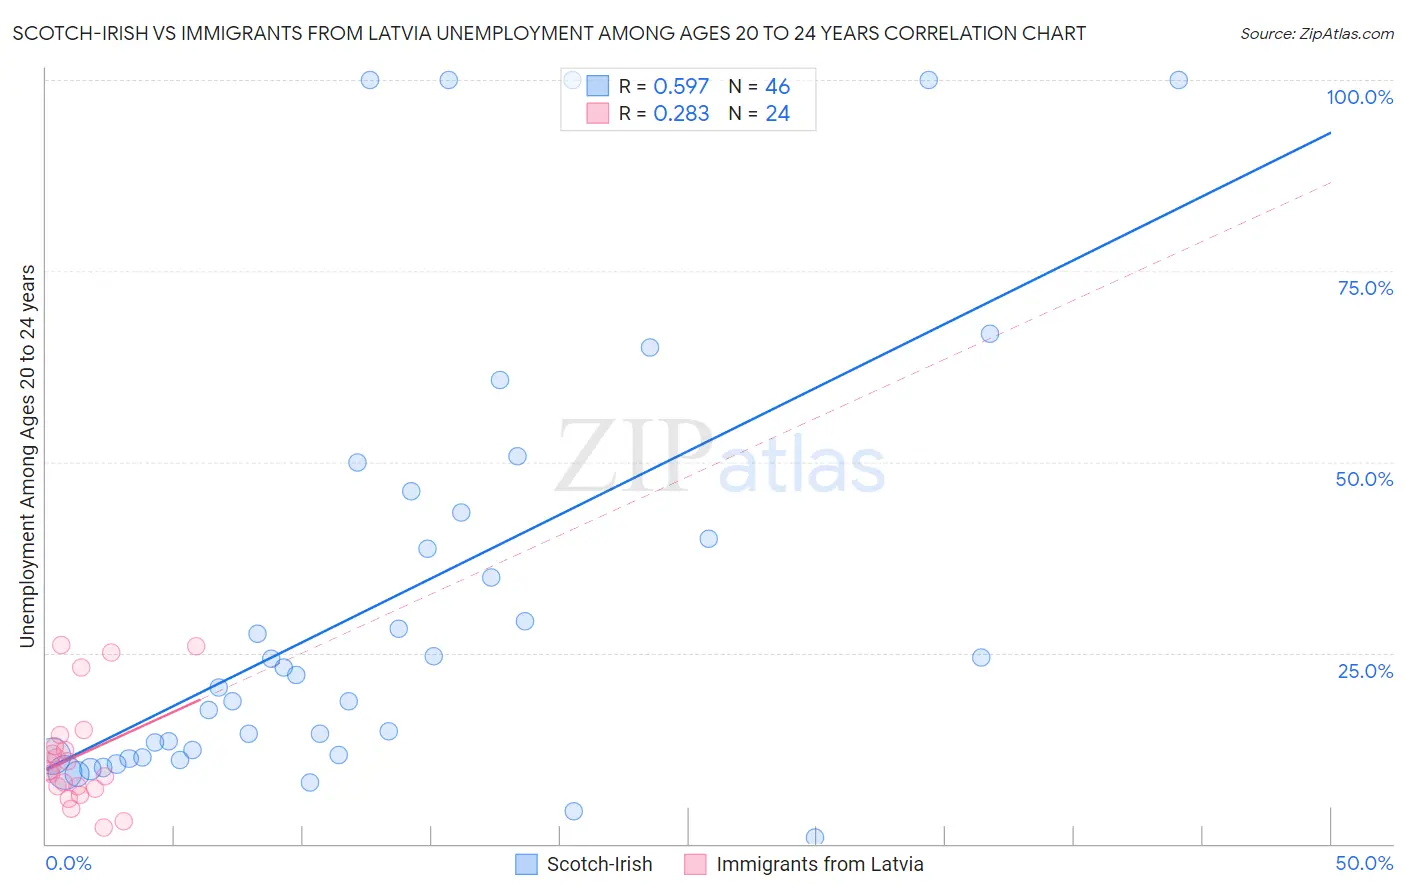
Scotch-Irish vs Immigrants from Latvia Unemployment Among Ages 20 to 24 years Correlation Chart
The statistical analysis conducted on geographies consisting of 505,476,412 people shows a substantial positive correlation between the proportion of Scotch-Irish and unemployment rate among population between the ages 20 and 24 in the United States with a correlation coefficient (R) of 0.597 and weighted average of 10.0%. Similarly, the statistical analysis conducted on geographies consisting of 112,554,162 people shows a weak positive correlation between the proportion of Immigrants from Latvia and unemployment rate among population between the ages 20 and 24 in the United States with a correlation coefficient (R) of 0.283 and weighted average of 10.1%, a difference of 0.58%.
Unemployment Among Ages 20 to 24 years Correlation Summary
| Measurement | Scotch-Irish | Immigrants from Latvia |
| Minimum | 0.90% | 2.1% |
| Maximum | 100.0% | 26.0% |
| Range | 99.1% | 23.9% |
| Mean | 32.1% | 11.6% |
| Median | 21.2% | 9.8% |
| Interquartile 25% (IQ1) | 11.5% | 7.3% |
| Interquartile 75% (IQ3) | 43.4% | 13.5% |
| Interquartile Range (IQR) | 31.9% | 6.2% |
| Standard Deviation (Sample) | 28.8% | 6.9% |
| Standard Deviation (Population) | 28.5% | 6.8% |
Demographics Similar to Scotch-Irish and Immigrants from Latvia by Unemployment Among Ages 20 to 24 years
In terms of unemployment among ages 20 to 24 years, the demographic groups most similar to Scotch-Irish are Thai (10.0%, a difference of 0.0%), Slavic (10.0%, a difference of 0.040%), Immigrants from Micronesia (10.0%, a difference of 0.10%), Immigrants from Malaysia (10.0%, a difference of 0.19%), and Bangladeshi (10.0%, a difference of 0.20%). Similarly, the demographic groups most similar to Immigrants from Latvia are Filipino (10.1%, a difference of 0.0%), Immigrants from Spain (10.1%, a difference of 0.010%), Iroquois (10.1%, a difference of 0.030%), Immigrants from Indonesia (10.1%, a difference of 0.070%), and Pennsylvania German (10.0%, a difference of 0.10%).
| Demographics | Rating | Rank | Unemployment Among Ages 20 to 24 years |
| Bhutanese | 96.9 /100 | #91 | Exceptional 10.0% |
| Bangladeshis | 96.9 /100 | #92 | Exceptional 10.0% |
| Immigrants | Malaysia | 96.9 /100 | #93 | Exceptional 10.0% |
| Immigrants | Micronesia | 96.6 /100 | #94 | Exceptional 10.0% |
| Scotch-Irish | 96.2 /100 | #95 | Exceptional 10.0% |
| Thais | 96.2 /100 | #96 | Exceptional 10.0% |
| Slavs | 96.1 /100 | #97 | Exceptional 10.0% |
| Japanese | 95.4 /100 | #98 | Exceptional 10.0% |
| Fijians | 95.3 /100 | #99 | Exceptional 10.0% |
| Immigrants | France | 95.2 /100 | #100 | Exceptional 10.0% |
| Laotians | 95.1 /100 | #101 | Exceptional 10.0% |
| Immigrants | Argentina | 94.9 /100 | #102 | Exceptional 10.0% |
| Irish | 94.3 /100 | #103 | Exceptional 10.0% |
| Immigrants | Chile | 94.0 /100 | #104 | Exceptional 10.0% |
| Immigrants | Hungary | 94.0 /100 | #105 | Exceptional 10.0% |
| Pennsylvania Germans | 93.9 /100 | #106 | Exceptional 10.0% |
| Iroquois | 93.4 /100 | #107 | Exceptional 10.1% |
| Immigrants | Latvia | 93.2 /100 | #108 | Exceptional 10.1% |
| Filipinos | 93.2 /100 | #109 | Exceptional 10.1% |
| Immigrants | Spain | 93.1 /100 | #110 | Exceptional 10.1% |
| Immigrants | Indonesia | 92.7 /100 | #111 | Exceptional 10.1% |