Scotch-Irish vs Immigrants from Netherlands Unemployment Among Ages 20 to 24 years
COMPARE
Scotch-Irish
Immigrants from Netherlands
Unemployment Among Ages 20 to 24 years
Unemployment Among Ages 20 to 24 years Comparison
Scotch-Irish
Immigrants from Netherlands
10.0%
UNEMPLOYMENT AMONG AGES 20 TO 24 YEARS
96.2/ 100
METRIC RATING
95th/ 347
METRIC RANK
9.9%
UNEMPLOYMENT AMONG AGES 20 TO 24 YEARS
98.2/ 100
METRIC RATING
80th/ 347
METRIC RANK
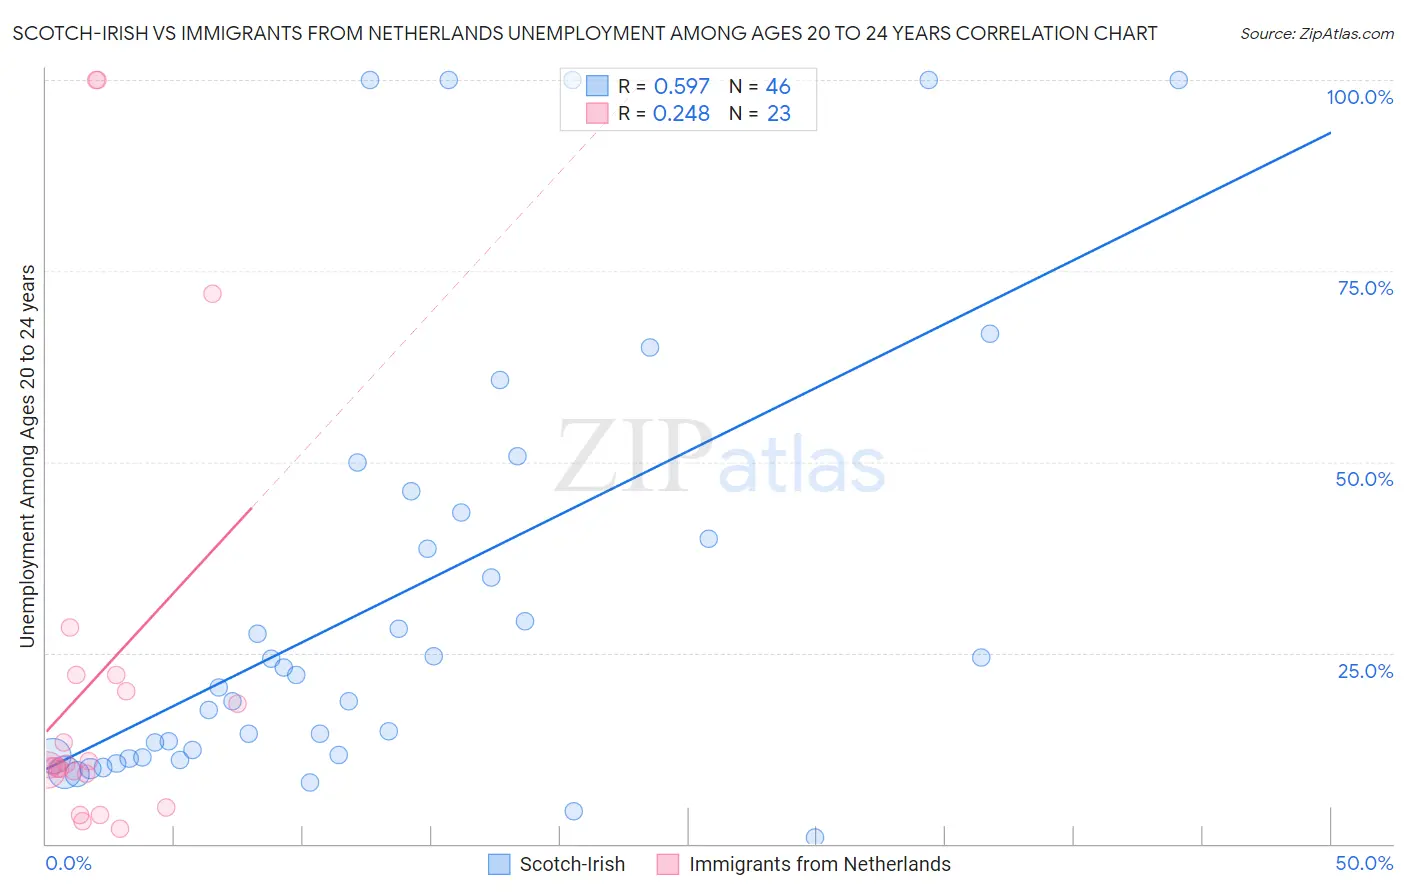
Scotch-Irish vs Immigrants from Netherlands Unemployment Among Ages 20 to 24 years Correlation Chart
The statistical analysis conducted on geographies consisting of 505,476,412 people shows a substantial positive correlation between the proportion of Scotch-Irish and unemployment rate among population between the ages 20 and 24 in the United States with a correlation coefficient (R) of 0.597 and weighted average of 10.0%. Similarly, the statistical analysis conducted on geographies consisting of 232,390,295 people shows a weak positive correlation between the proportion of Immigrants from Netherlands and unemployment rate among population between the ages 20 and 24 in the United States with a correlation coefficient (R) of 0.248 and weighted average of 9.9%, a difference of 0.73%.
Unemployment Among Ages 20 to 24 years Correlation Summary
| Measurement | Scotch-Irish | Immigrants from Netherlands |
| Minimum | 0.90% | 2.0% |
| Maximum | 100.0% | 100.0% |
| Range | 99.1% | 98.0% |
| Mean | 32.1% | 21.9% |
| Median | 21.2% | 10.2% |
| Interquartile 25% (IQ1) | 11.5% | 9.2% |
| Interquartile 75% (IQ3) | 43.4% | 22.1% |
| Interquartile Range (IQR) | 31.9% | 12.9% |
| Standard Deviation (Sample) | 28.8% | 28.5% |
| Standard Deviation (Population) | 28.5% | 27.8% |
Demographics Similar to Scotch-Irish and Immigrants from Netherlands by Unemployment Among Ages 20 to 24 years
In terms of unemployment among ages 20 to 24 years, the demographic groups most similar to Scotch-Irish are Thai (10.0%, a difference of 0.0%), Slavic (10.0%, a difference of 0.040%), Immigrants from Micronesia (10.0%, a difference of 0.10%), Immigrants from Malaysia (10.0%, a difference of 0.19%), and Bangladeshi (10.0%, a difference of 0.20%). Similarly, the demographic groups most similar to Immigrants from Netherlands are Icelander (9.9%, a difference of 0.040%), Assyrian/Chaldean/Syriac (9.9%, a difference of 0.070%), Chickasaw (9.9%, a difference of 0.10%), Yaqui (9.9%, a difference of 0.11%), and Sri Lankan (9.9%, a difference of 0.12%).
| Demographics | Rating | Rank | Unemployment Among Ages 20 to 24 years |
| Chickasaw | 98.4 /100 | #77 | Exceptional 9.9% |
| Assyrians/Chaldeans/Syriacs | 98.3 /100 | #78 | Exceptional 9.9% |
| Icelanders | 98.3 /100 | #79 | Exceptional 9.9% |
| Immigrants | Netherlands | 98.2 /100 | #80 | Exceptional 9.9% |
| Yaqui | 98.0 /100 | #81 | Exceptional 9.9% |
| Sri Lankans | 98.0 /100 | #82 | Exceptional 9.9% |
| Immigrants | Bulgaria | 98.0 /100 | #83 | Exceptional 9.9% |
| Latvians | 97.9 /100 | #84 | Exceptional 9.9% |
| New Zealanders | 97.8 /100 | #85 | Exceptional 9.9% |
| Immigrants | Vietnam | 97.5 /100 | #86 | Exceptional 10.0% |
| Immigrants | Oceania | 97.4 /100 | #87 | Exceptional 10.0% |
| Poles | 97.1 /100 | #88 | Exceptional 10.0% |
| Macedonians | 97.0 /100 | #89 | Exceptional 10.0% |
| Chileans | 97.0 /100 | #90 | Exceptional 10.0% |
| Bhutanese | 96.9 /100 | #91 | Exceptional 10.0% |
| Bangladeshis | 96.9 /100 | #92 | Exceptional 10.0% |
| Immigrants | Malaysia | 96.9 /100 | #93 | Exceptional 10.0% |
| Immigrants | Micronesia | 96.6 /100 | #94 | Exceptional 10.0% |
| Scotch-Irish | 96.2 /100 | #95 | Exceptional 10.0% |
| Thais | 96.2 /100 | #96 | Exceptional 10.0% |
| Slavs | 96.1 /100 | #97 | Exceptional 10.0% |