White/Caucasian vs Subsaharan African Unemployment Among Ages 20 to 24 years
COMPARE
White/Caucasian
Subsaharan African
Unemployment Among Ages 20 to 24 years
Unemployment Among Ages 20 to 24 years Comparison
Whites/Caucasians
Sub-Saharan Africans
10.1%
UNEMPLOYMENT AMONG AGES 20 TO 24 YEARS
87.4/ 100
METRIC RATING
122nd/ 347
METRIC RANK
11.1%
UNEMPLOYMENT AMONG AGES 20 TO 24 YEARS
0.0/ 100
METRIC RATING
264th/ 347
METRIC RANK
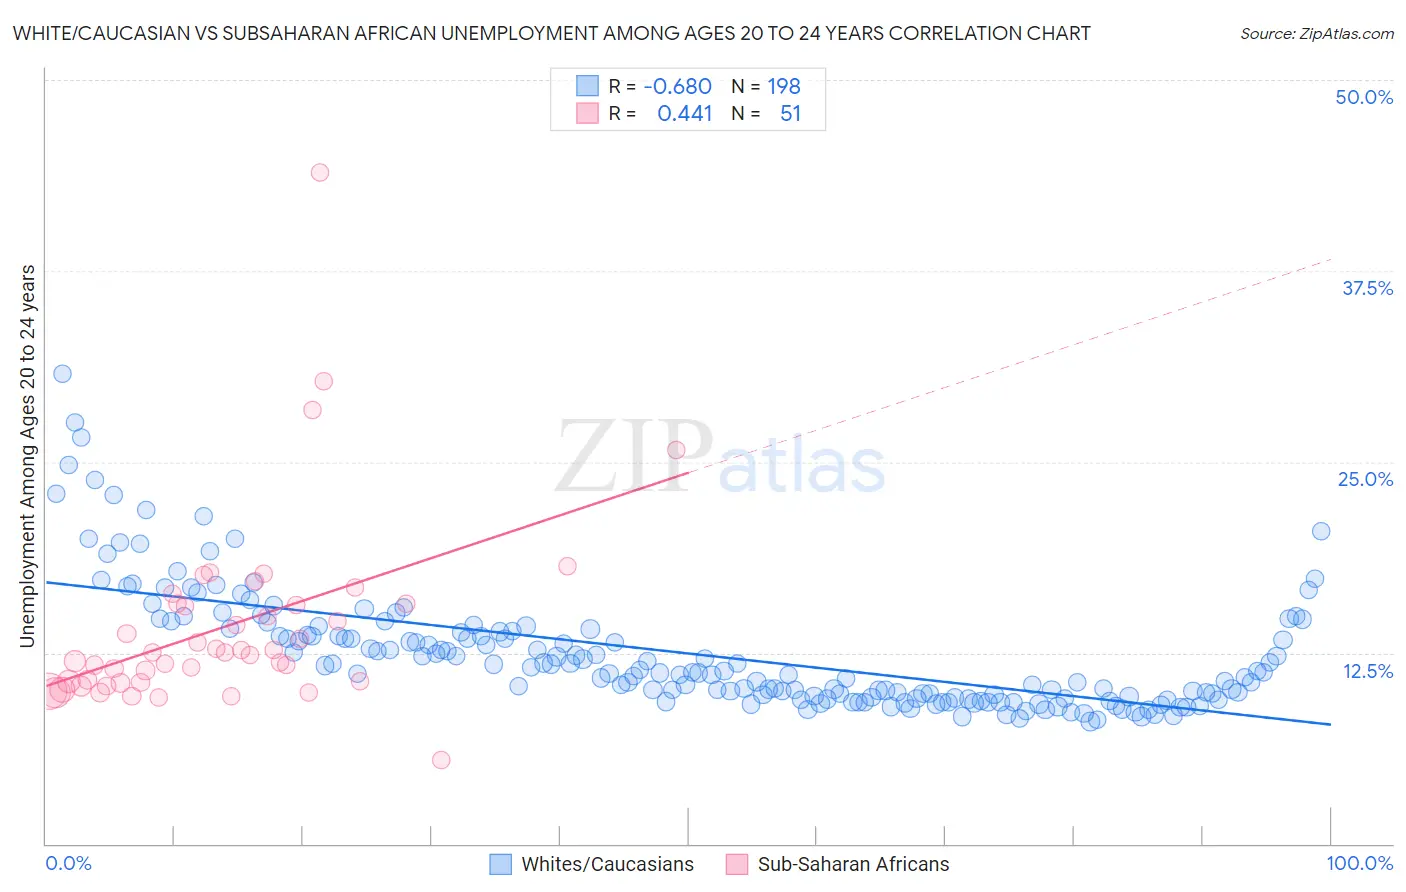
White/Caucasian vs Subsaharan African Unemployment Among Ages 20 to 24 years Correlation Chart
The statistical analysis conducted on geographies consisting of 530,440,022 people shows a significant negative correlation between the proportion of Whites/Caucasians and unemployment rate among population between the ages 20 and 24 in the United States with a correlation coefficient (R) of -0.680 and weighted average of 10.1%. Similarly, the statistical analysis conducted on geographies consisting of 484,655,808 people shows a moderate positive correlation between the proportion of Sub-Saharan Africans and unemployment rate among population between the ages 20 and 24 in the United States with a correlation coefficient (R) of 0.441 and weighted average of 11.1%, a difference of 9.4%.
Unemployment Among Ages 20 to 24 years Correlation Summary
| Measurement | White/Caucasian | Subsaharan African |
| Minimum | 8.0% | 5.5% |
| Maximum | 30.8% | 43.9% |
| Range | 22.8% | 38.4% |
| Mean | 12.5% | 14.2% |
| Median | 11.3% | 12.5% |
| Interquartile 25% (IQ1) | 9.6% | 10.5% |
| Interquartile 75% (IQ3) | 13.9% | 15.7% |
| Interquartile Range (IQR) | 4.3% | 5.2% |
| Standard Deviation (Sample) | 3.9% | 6.3% |
| Standard Deviation (Population) | 3.9% | 6.2% |
Similar Demographics by Unemployment Among Ages 20 to 24 years
Demographics Similar to Whites/Caucasians by Unemployment Among Ages 20 to 24 years
In terms of unemployment among ages 20 to 24 years, the demographic groups most similar to Whites/Caucasians are Immigrants from Iraq (10.1%, a difference of 0.020%), South African (10.1%, a difference of 0.040%), Immigrants from Canada (10.1%, a difference of 0.070%), Immigrants from Japan (10.1%, a difference of 0.070%), and French (10.1%, a difference of 0.080%).
| Demographics | Rating | Rank | Unemployment Among Ages 20 to 24 years |
| Immigrants | Morocco | 90.5 /100 | #115 | Exceptional 10.1% |
| Basques | 89.8 /100 | #116 | Excellent 10.1% |
| Immigrants | Uruguay | 89.6 /100 | #117 | Excellent 10.1% |
| Paraguayans | 88.6 /100 | #118 | Excellent 10.1% |
| French | 88.2 /100 | #119 | Excellent 10.1% |
| Immigrants | Canada | 88.2 /100 | #120 | Excellent 10.1% |
| South Africans | 87.8 /100 | #121 | Excellent 10.1% |
| Whites/Caucasians | 87.4 /100 | #122 | Excellent 10.1% |
| Immigrants | Iraq | 87.1 /100 | #123 | Excellent 10.1% |
| Immigrants | Japan | 86.5 /100 | #124 | Excellent 10.1% |
| Spanish | 86.1 /100 | #125 | Excellent 10.1% |
| Jordanians | 86.1 /100 | #126 | Excellent 10.1% |
| Immigrants | Norway | 85.3 /100 | #127 | Excellent 10.1% |
| Immigrants | Brazil | 84.9 /100 | #128 | Excellent 10.1% |
| Immigrants | South Central Asia | 84.6 /100 | #129 | Excellent 10.1% |
Demographics Similar to Sub-Saharan Africans by Unemployment Among Ages 20 to 24 years
In terms of unemployment among ages 20 to 24 years, the demographic groups most similar to Sub-Saharan Africans are Immigrants from Ireland (11.1%, a difference of 0.070%), Immigrants from Liberia (11.1%, a difference of 0.16%), Immigrants from Greece (11.1%, a difference of 0.44%), Marshallese (11.0%, a difference of 0.75%), and Maltese (11.2%, a difference of 0.89%).
| Demographics | Rating | Rank | Unemployment Among Ages 20 to 24 years |
| Immigrants | Western Asia | 0.3 /100 | #257 | Tragic 10.9% |
| Dutch West Indians | 0.3 /100 | #258 | Tragic 10.9% |
| Panamanians | 0.2 /100 | #259 | Tragic 10.9% |
| Immigrants | Lebanon | 0.2 /100 | #260 | Tragic 10.9% |
| Puget Sound Salish | 0.2 /100 | #261 | Tragic 10.9% |
| Immigrants | Latin America | 0.1 /100 | #262 | Tragic 11.0% |
| Marshallese | 0.1 /100 | #263 | Tragic 11.0% |
| Sub-Saharan Africans | 0.0 /100 | #264 | Tragic 11.1% |
| Immigrants | Ireland | 0.0 /100 | #265 | Tragic 11.1% |
| Immigrants | Liberia | 0.0 /100 | #266 | Tragic 11.1% |
| Immigrants | Greece | 0.0 /100 | #267 | Tragic 11.1% |
| Maltese | 0.0 /100 | #268 | Tragic 11.2% |
| Ute | 0.0 /100 | #269 | Tragic 11.2% |
| Delaware | 0.0 /100 | #270 | Tragic 11.3% |
| Immigrants | Uzbekistan | 0.0 /100 | #271 | Tragic 11.4% |