Osage vs Immigrants from Oceania Female Unemployment

COMPARE

Osage
Race
Ancestry
AfghanAfricanAlaska NativeAlaskan AthabascanAlbanianAleutAlsatianAmericanApacheArabArapahoArgentineanArmenianAssyrian/Chaldean/SyriacAustralianAustrianBahamianBangladeshiBarbadianBasqueBelgianBelizeanBermudanBhutaneseBlackfeetBolivianBrazilianBritishBritish West IndianBulgarianBurmeseCajunCambodianCanadianCape VerdeanCarpatho RusynCelticCentral AmericanCentral American IndianCherokeeCheyenneChickasawChileanChineseChippewaChoctawColombianColvilleComancheCosta RicanCreeCreekCroatianCrowCubanCypriotCzechCzechoslovakianDanishDelawareDominicanDutchDutch West IndianEastern EuropeanEcuadorianEgyptianEnglishEstonianEthiopianEuropeanFijianFilipinoFinnishFrenchFrench American IndianFrench CanadianGermanGerman RussianGhanaianGreekGuamanian/ChamorroGuatemalanGuyaneseHaitianHmongHonduranHopiHoumaHungarianIcelanderIndian (Asian)IndonesianInupiatIranianIraqiIrishIroquoisIsraeliItalianJamaicanJapaneseJordanianKenyanKiowaKoreanLaotianLatvianLebaneseLiberianLithuanianLumbeeLuxembourgerMacedonianMalaysianMalteseMarshalleseMenomineeMexicanMexican American IndianMongolianMoroccanNative HawaiianNavajoNepaleseNew ZealanderNicaraguanNigerianNorthern EuropeanNorwegianOkinawanOsageOttawaPaiutePakistaniPalestinianPanamanianParaguayanPennsylvania GermanPeruvianPimaPolishPortuguesePotawatomiPuebloPuerto RicanPuget Sound SalishRomanianRussianSalvadoranSamoanScandinavianScotch-IrishScottishSeminoleSenegaleseSerbianShoshoneSierra LeoneanSiouxSlavicSlovakSloveneSomaliSouth AfricanSouth AmericanSouth American IndianSoviet UnionSpaniardSpanishSpanish AmericanSpanish American IndianSri LankanSubsaharan AfricanSudaneseSwedishSwissSyrianTaiwaneseThaiTlingit-HaidaTohono O'OdhamTonganTrinidadian and TobagonianTsimshianTurkishU.S. Virgin IslanderUgandanUkrainianUruguayanUteVenezuelanVietnameseWelshWest IndianYakamaYaquiYugoslavianYumanYup'ikZimbabwean
Immigration
NonimmigrantsImmigrantsAfghanistanAfricaAlbaniaArgentinaArmeniaAsiaAustraliaAustriaBahamasBangladeshBarbadosBelarusBelgiumBelizeBoliviaBosnia and HerzegovinaBrazilBulgariaBurma/MyanmarCabo VerdeCambodiaCameroonCanadaCaribbeanCentral AmericaChileChinaColombiaCongoCosta RicaCroatiaCubaCzechoslovakiaDenmarkDominicaDominican RepublicEastern AfricaEastern AsiaEastern EuropeEcuadorEgyptEl SalvadorEnglandEritreaEthiopiaEuropeFijiFranceGermanyGhanaGreeceGrenadaGuatemalaGuyanaHaitiHondurasHong KongHungaryIndiaIndonesiaIranIraqIrelandIsraelItalyJamaicaJapanJordanKazakhstanKenyaKoreaKuwaitLaosLatin AmericaLatviaLebanonLiberiaLithuaniaMalaysiaMexicoMicronesiaMiddle AfricaMoldovaMoroccoNepalNetherlandsNicaraguaNigeriaNorth AmericaNorth MacedoniaNorthern AfricaNorthern EuropeNorwayPakistanPanamaPeruPhilippinesPolandPortugalRomaniaRussiaSaudi ArabiaScotlandSenegalSerbiaSierra LeoneSingaporeSomaliaSouth AfricaSouth AmericaSouth Central AsiaSouth Eastern AsiaSouthern EuropeSpainSri LankaSt. Vincent and the GrenadinesSudanSwedenSwitzerlandSyriaTaiwanThailandTrinidad and TobagoTurkeyUgandaUkraineUruguayUzbekistanVenezuelaVietnamWest IndiesWestern AfricaWestern AsiaWestern EuropeYemenZaireZimbabweAzores
Immigrants from Oceania
Race
Ancestry
AfghanAfricanAlaska NativeAlaskan AthabascanAlbanianAleutAlsatianAmericanApacheArabArapahoArgentineanArmenianAssyrian/Chaldean/SyriacAustralianAustrianBahamianBangladeshiBarbadianBasqueBelgianBelizeanBermudanBhutaneseBlackfeetBolivianBrazilianBritishBritish West IndianBulgarianBurmeseCajunCambodianCanadianCape VerdeanCarpatho RusynCelticCentral AmericanCentral American IndianCherokeeCheyenneChickasawChileanChineseChippewaChoctawColombianColvilleComancheCosta RicanCreeCreekCroatianCrowCubanCypriotCzechCzechoslovakianDanishDelawareDominicanDutchDutch West IndianEastern EuropeanEcuadorianEgyptianEnglishEstonianEthiopianEuropeanFijianFilipinoFinnishFrenchFrench American IndianFrench CanadianGermanGerman RussianGhanaianGreekGuamanian/ChamorroGuatemalanGuyaneseHaitianHmongHonduranHopiHoumaHungarianIcelanderIndian (Asian)IndonesianInupiatIranianIraqiIrishIroquoisIsraeliItalianJamaicanJapaneseJordanianKenyanKiowaKoreanLaotianLatvianLebaneseLiberianLithuanianLumbeeLuxembourgerMacedonianMalaysianMalteseMarshalleseMenomineeMexicanMexican American IndianMongolianMoroccanNative HawaiianNavajoNepaleseNew ZealanderNicaraguanNigerianNorthern EuropeanNorwegianOkinawanOttawaPaiutePakistaniPalestinianPanamanianParaguayanPennsylvania GermanPeruvianPimaPolishPortuguesePotawatomiPuebloPuerto RicanPuget Sound SalishRomanianRussianSalvadoranSamoanScandinavianScotch-IrishScottishSeminoleSenegaleseSerbianShoshoneSierra LeoneanSiouxSlavicSlovakSloveneSomaliSouth AfricanSouth AmericanSouth American IndianSoviet UnionSpaniardSpanishSpanish AmericanSpanish American IndianSri LankanSubsaharan AfricanSudaneseSwedishSwissSyrianTaiwaneseThaiTlingit-HaidaTohono O'OdhamTonganTrinidadian and TobagonianTsimshianTurkishU.S. Virgin IslanderUgandanUkrainianUruguayanUteVenezuelanVietnameseWelshWest IndianYakamaYaquiYugoslavianYumanYup'ikZimbabwean
Immigration
NonimmigrantsImmigrantsAfghanistanAfricaAlbaniaArgentinaArmeniaAsiaAustraliaAustriaBahamasBangladeshBarbadosBelarusBelgiumBelizeBoliviaBosnia and HerzegovinaBrazilBulgariaBurma/MyanmarCabo VerdeCambodiaCameroonCanadaCaribbeanCentral AmericaChileChinaColombiaCongoCosta RicaCroatiaCubaCzechoslovakiaDenmarkDominicaDominican RepublicEastern AfricaEastern AsiaEastern EuropeEcuadorEgyptEl SalvadorEnglandEritreaEthiopiaEuropeFijiFranceGermanyGhanaGreeceGrenadaGuatemalaGuyanaHaitiHondurasHong KongHungaryIndiaIndonesiaIranIraqIrelandIsraelItalyJamaicaJapanJordanKazakhstanKenyaKoreaKuwaitLaosLatin AmericaLatviaLebanonLiberiaLithuaniaMalaysiaMexicoMicronesiaMiddle AfricaMoldovaMoroccoNepalNetherlandsNicaraguaNigeriaNorth AmericaNorth MacedoniaNorthern AfricaNorthern EuropeNorwayOceaniaPakistanPanamaPeruPhilippinesPolandPortugalRomaniaRussiaSaudi ArabiaScotlandSenegalSerbiaSierra LeoneSingaporeSomaliaSouth AfricaSouth AmericaSouth Central AsiaSouth Eastern AsiaSouthern EuropeSpainSri LankaSt. Vincent and the GrenadinesSudanSwedenSwitzerlandSyriaTaiwanThailandTrinidad and TobagoTurkeyUgandaUkraineUruguayUzbekistanVenezuelaVietnamWest IndiesWestern AfricaWestern AsiaWestern EuropeYemenZaireZimbabweAzores
Female Unemployment
Income
Poverty
Unemployment
Labor Participation
Family Structure
Vehicle Availability
Education Level
Disability

Female Unemployment Comparison

Osage

Immigrants from Oceania

Exceptional
Good
4.9%
FEMALE UNEMPLOYMENT
98.2/ 100
METRIC RATING
70th/ 347
METRIC RANK
5.2%
FEMALE UNEMPLOYMENT
79.5/ 100
METRIC RATING
145th/ 347
METRIC RANK

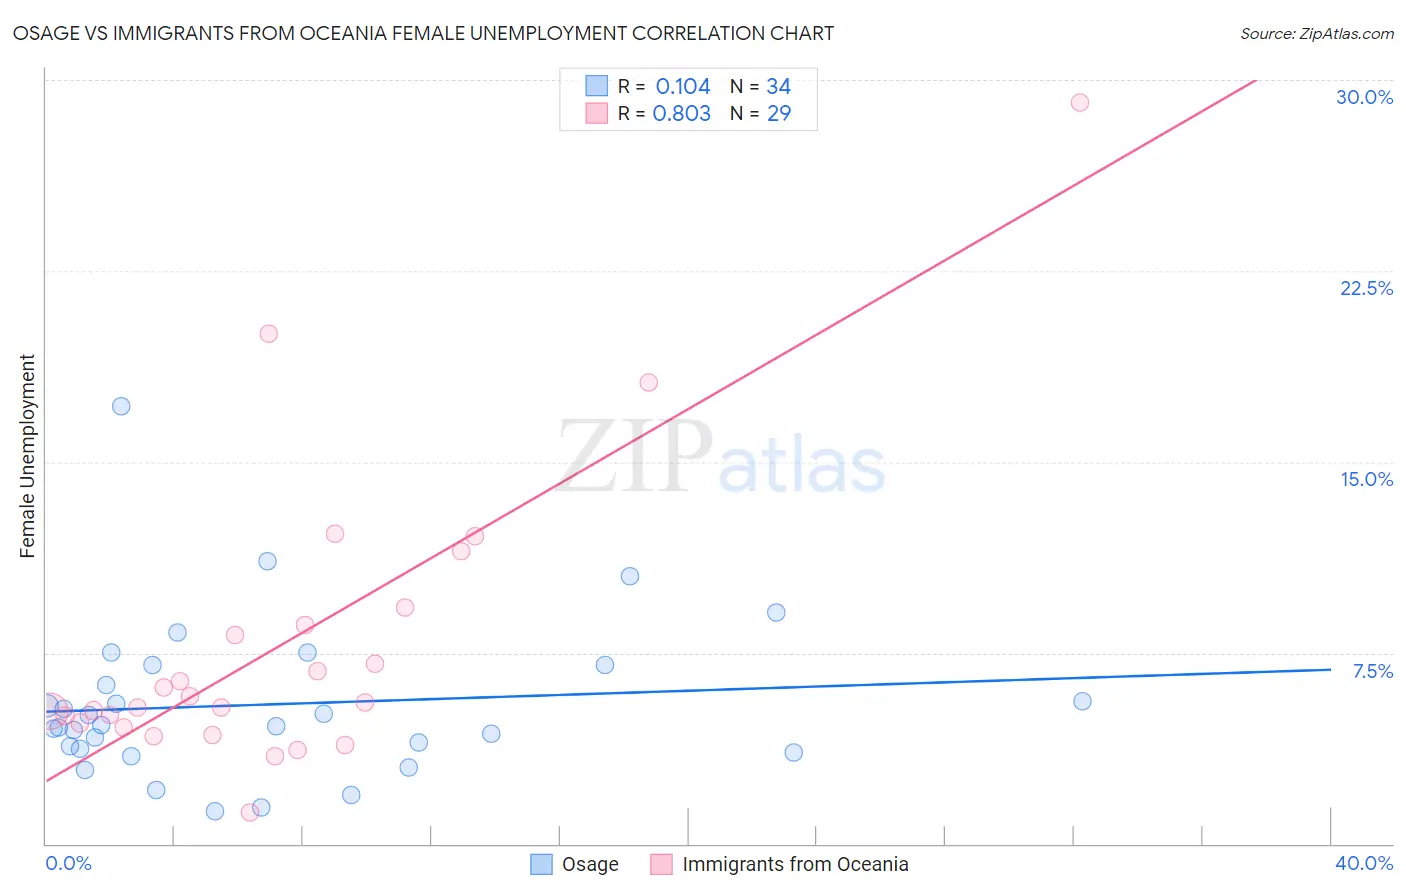
Osage vs Immigrants from Oceania Female Unemployment Correlation Chart

The statistical analysis conducted on geographies consisting of 91,544,897 people shows a poor positive correlation between the proportion of Osage and unemploymnet rate among females in the United States with a correlation coefficient (R) of 0.104 and weighted average of 4.9%. Similarly, the statistical analysis conducted on geographies consisting of 304,351,716 people shows a very strong positive correlation between the proportion of Immigrants from Oceania and unemploymnet rate among females in the United States with a correlation coefficient (R) of 0.803 and weighted average of 5.2%, a difference of 4.2%.
Osage vs Immigrants from Oceania Female Unemployment

Female Unemployment Correlation Summary

MeasurementOsageImmigrants from Oceania
Minimum1.3%1.2%
Maximum17.2%29.1%
Range15.9%27.9%
Mean5.5%7.9%
Median4.6%5.5%
Interquartile 25% (IQ1)3.7%4.7%
Interquartile 75% (IQ3)7.0%8.9%
Interquartile Range (IQR)3.3%4.3%
Standard Deviation (Sample)3.1%5.9%
Standard Deviation (Population)3.1%5.8%

Similar Demographics by Female Unemployment

Demographics Similar to Osage by Female Unemployment

In terms of female unemployment, the demographic groups most similar to Osage are Immigrants from Ireland (4.9%, a difference of 0.040%), Tlingit-Haida (4.9%, a difference of 0.050%), Hungarian (4.9%, a difference of 0.060%), Cuban (4.9%, a difference of 0.060%), and German Russian (4.9%, a difference of 0.080%).
DemographicsRating | RankFemale Unemployment
Immigrants | Belgium
98.5
/100
|
#63
Exceptional
4.9%
Celtics
98.5
/100
|
#64
Exceptional
4.9%
Immigrants | North America
98.3
/100
|
#65
Exceptional
4.9%
Hungarians
98.3
/100
|
#66
Exceptional
4.9%
Cubans
98.3
/100
|
#67
Exceptional
4.9%
Tlingit-Haida
98.3
/100
|
#68
Exceptional
4.9%
Immigrants | Ireland
98.2
/100
|
#69
Exceptional
4.9%
Osage
98.2
/100
|
#70
Exceptional
4.9%
German Russians
98.1
/100
|
#71
Exceptional
4.9%
Immigrants | Northern Europe
98.0
/100
|
#72
Exceptional
4.9%
Russians
98.0
/100
|
#73
Exceptional
5.0%
Immigrants | Bolivia
98.0
/100
|
#74
Exceptional
5.0%
Immigrants | Singapore
98.0
/100
|
#75
Exceptional
5.0%
Immigrants | Venezuela
97.9
/100
|
#76
Exceptional
5.0%
Mongolians
97.8
/100
|
#77
Exceptional
5.0%

Demographics Similar to Immigrants from Oceania by Female Unemployment

In terms of female unemployment, the demographic groups most similar to Immigrants from Oceania are Immigrants from Norway (5.2%, a difference of 0.010%), Argentinean (5.2%, a difference of 0.030%), Immigrants from Argentina (5.2%, a difference of 0.070%), Immigrants from Jordan (5.1%, a difference of 0.090%), and Asian (5.2%, a difference of 0.11%).
DemographicsRating | RankFemale Unemployment
Chickasaw
83.2
/100
|
#138
Excellent
5.1%
Immigrants | Eastern Asia
83.0
/100
|
#139
Excellent
5.1%
Immigrants | France
82.7
/100
|
#140
Excellent
5.1%
Immigrants | Eastern Europe
81.5
/100
|
#141
Excellent
5.1%
Palestinians
80.8
/100
|
#142
Excellent
5.1%
Immigrants | Kazakhstan
80.7
/100
|
#143
Excellent
5.1%
Immigrants | Jordan
80.4
/100
|
#144
Excellent
5.1%
Immigrants | Oceania
79.5
/100
|
#145
Good
5.2%
Immigrants | Norway
79.4
/100
|
#146
Good
5.2%
Argentineans
79.2
/100
|
#147
Good
5.2%
Immigrants | Argentina
78.7
/100
|
#148
Good
5.2%
Asians
78.3
/100
|
#149
Good
5.2%
Egyptians
78.3
/100
|
#150
Good
5.2%
Immigrants | China
75.9
/100
|
#151
Good
5.2%
Immigrants | Italy
75.0
/100
|
#152
Good
5.2%