Osage vs Immigrants from Sweden Female Unemployment
COMPARE
Osage
Immigrants from Sweden
Female Unemployment
Female Unemployment Comparison
Osage
Immigrants from Sweden
4.9%
FEMALE UNEMPLOYMENT
98.2/ 100
METRIC RATING
70th/ 347
METRIC RANK
5.0%
FEMALE UNEMPLOYMENT
96.3/ 100
METRIC RATING
90th/ 347
METRIC RANK
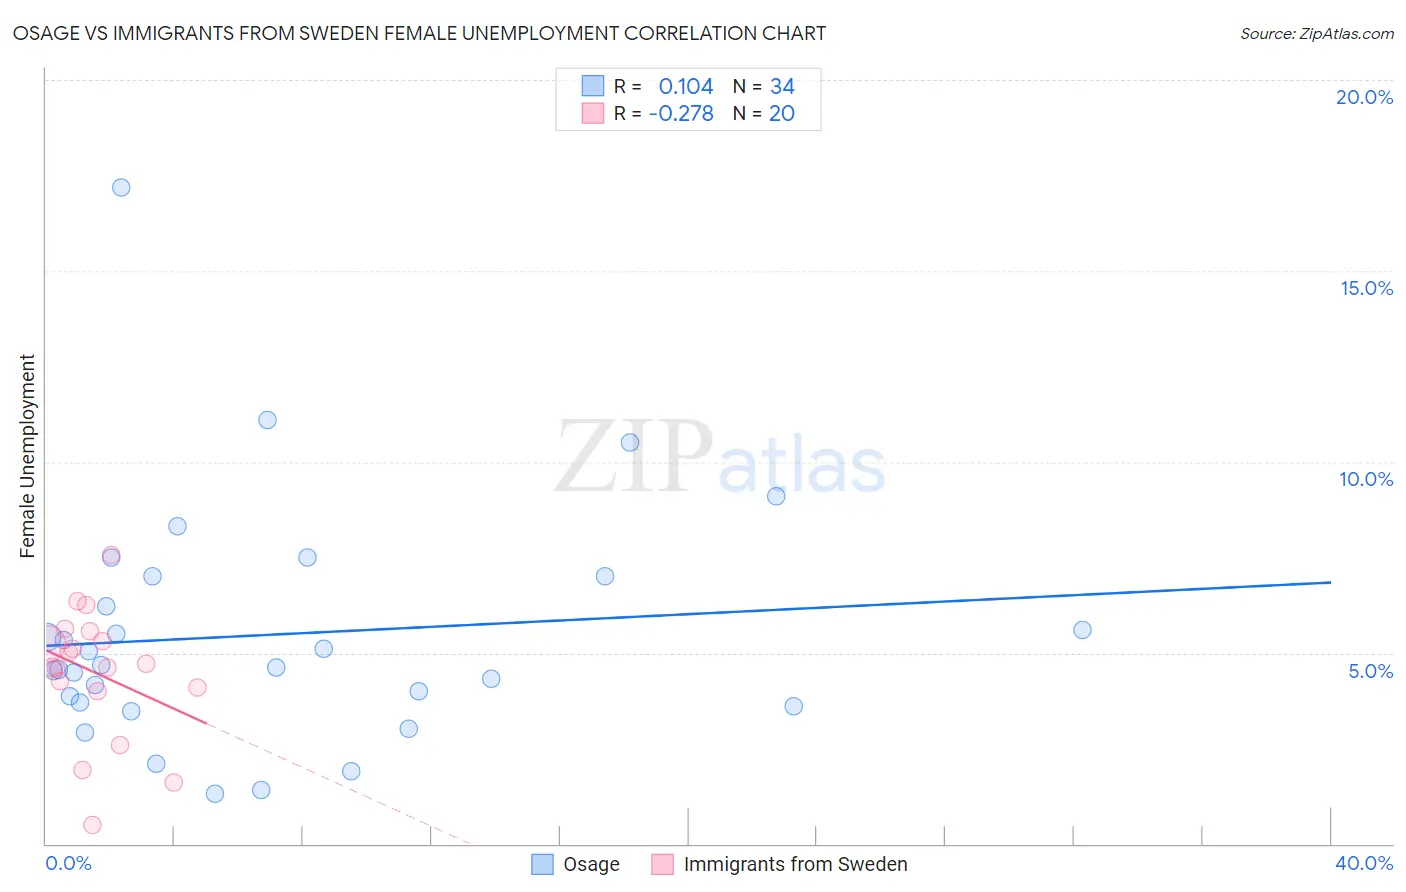
Osage vs Immigrants from Sweden Female Unemployment Correlation Chart
The statistical analysis conducted on geographies consisting of 91,544,897 people shows a poor positive correlation between the proportion of Osage and unemploymnet rate among females in the United States with a correlation coefficient (R) of 0.104 and weighted average of 4.9%. Similarly, the statistical analysis conducted on geographies consisting of 164,471,082 people shows a weak negative correlation between the proportion of Immigrants from Sweden and unemploymnet rate among females in the United States with a correlation coefficient (R) of -0.278 and weighted average of 5.0%, a difference of 1.2%.
Female Unemployment Correlation Summary
| Measurement | Osage | Immigrants from Sweden |
| Minimum | 1.3% | 0.50% |
| Maximum | 17.2% | 7.6% |
| Range | 15.9% | 7.1% |
| Mean | 5.5% | 4.5% |
| Median | 4.6% | 4.7% |
| Interquartile 25% (IQ1) | 3.7% | 4.1% |
| Interquartile 75% (IQ3) | 7.0% | 5.4% |
| Interquartile Range (IQR) | 3.3% | 1.4% |
| Standard Deviation (Sample) | 3.1% | 1.7% |
| Standard Deviation (Population) | 3.1% | 1.7% |
Demographics Similar to Osage and Immigrants from Sweden by Female Unemployment
In terms of female unemployment, the demographic groups most similar to Osage are German Russian (4.9%, a difference of 0.080%), Immigrants from Northern Europe (4.9%, a difference of 0.14%), Russian (5.0%, a difference of 0.18%), Immigrants from Bolivia (5.0%, a difference of 0.19%), and Immigrants from Singapore (5.0%, a difference of 0.21%). Similarly, the demographic groups most similar to Immigrants from Sweden are Immigrants from Taiwan (5.0%, a difference of 0.17%), Immigrants from Sudan (5.0%, a difference of 0.22%), Venezuelan (5.0%, a difference of 0.32%), Bolivian (5.0%, a difference of 0.40%), and Ukrainian (5.0%, a difference of 0.41%).
| Demographics | Rating | Rank | Female Unemployment |
| Osage | 98.2 /100 | #70 | Exceptional 4.9% |
| German Russians | 98.1 /100 | #71 | Exceptional 4.9% |
| Immigrants | Northern Europe | 98.0 /100 | #72 | Exceptional 4.9% |
| Russians | 98.0 /100 | #73 | Exceptional 5.0% |
| Immigrants | Bolivia | 98.0 /100 | #74 | Exceptional 5.0% |
| Immigrants | Singapore | 98.0 /100 | #75 | Exceptional 5.0% |
| Immigrants | Venezuela | 97.9 /100 | #76 | Exceptional 5.0% |
| Mongolians | 97.8 /100 | #77 | Exceptional 5.0% |
| Immigrants | Netherlands | 97.8 /100 | #78 | Exceptional 5.0% |
| Turks | 97.6 /100 | #79 | Exceptional 5.0% |
| New Zealanders | 97.4 /100 | #80 | Exceptional 5.0% |
| Filipinos | 97.3 /100 | #81 | Exceptional 5.0% |
| Immigrants | Australia | 97.3 /100 | #82 | Exceptional 5.0% |
| Immigrants | Serbia | 97.2 /100 | #83 | Exceptional 5.0% |
| Canadians | 97.2 /100 | #84 | Exceptional 5.0% |
| Ukrainians | 97.1 /100 | #85 | Exceptional 5.0% |
| Bolivians | 97.1 /100 | #86 | Exceptional 5.0% |
| Venezuelans | 96.9 /100 | #87 | Exceptional 5.0% |
| Immigrants | Sudan | 96.7 /100 | #88 | Exceptional 5.0% |
| Immigrants | Taiwan | 96.6 /100 | #89 | Exceptional 5.0% |
| Immigrants | Sweden | 96.3 /100 | #90 | Exceptional 5.0% |