Osage vs Immigrants from St. Vincent and the Grenadines Female Unemployment
COMPARE
Osage
Immigrants from St. Vincent and the Grenadines
Female Unemployment
Female Unemployment Comparison
Osage
Immigrants from St. Vincent and the Grenadines
4.9%
FEMALE UNEMPLOYMENT
98.2/ 100
METRIC RATING
70th/ 347
METRIC RANK
6.4%
FEMALE UNEMPLOYMENT
0.0/ 100
METRIC RATING
317th/ 347
METRIC RANK
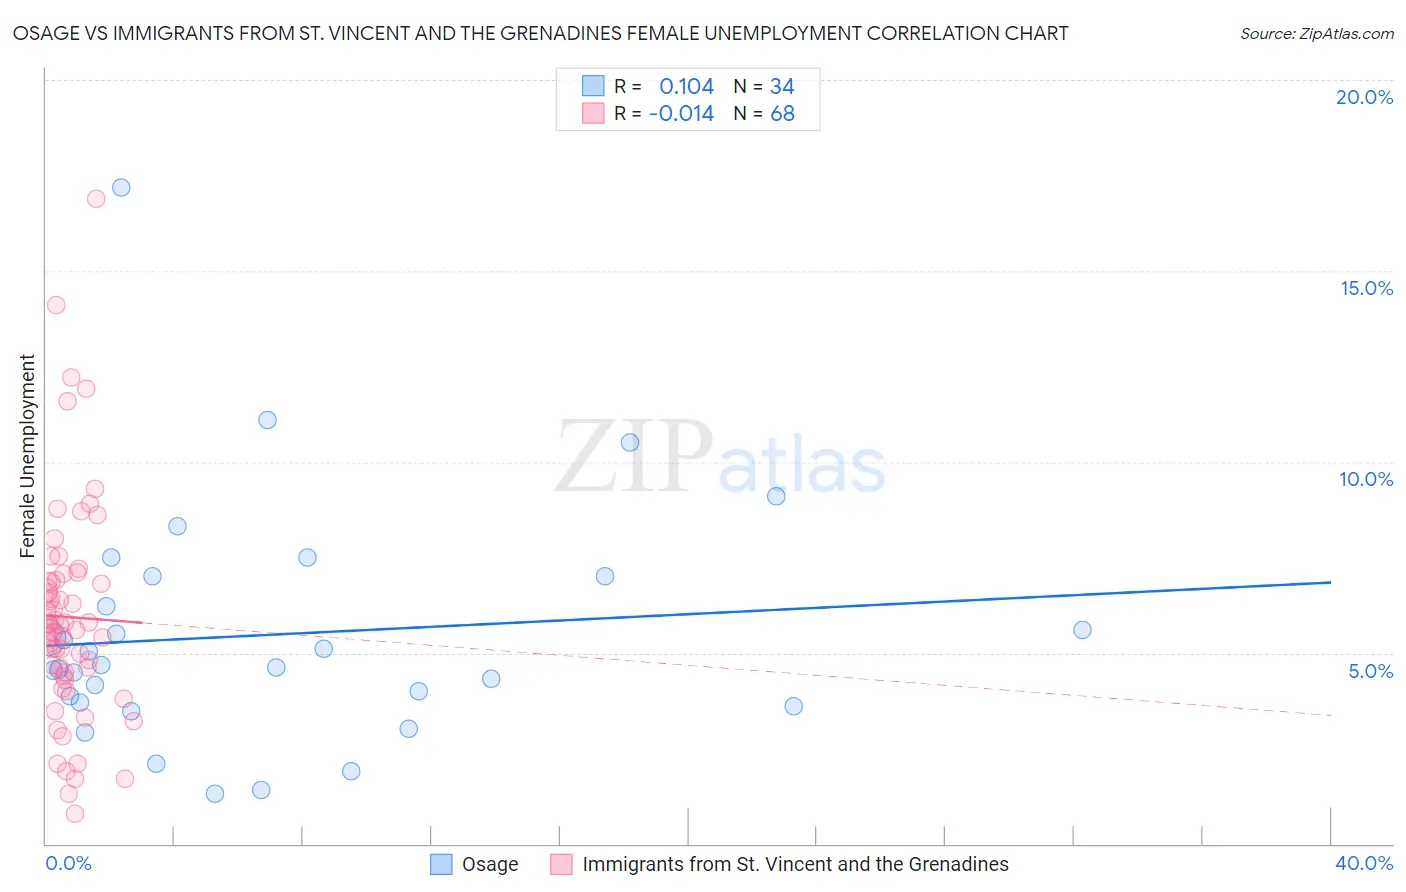
Osage vs Immigrants from St. Vincent and the Grenadines Female Unemployment Correlation Chart
The statistical analysis conducted on geographies consisting of 91,544,897 people shows a poor positive correlation between the proportion of Osage and unemploymnet rate among females in the United States with a correlation coefficient (R) of 0.104 and weighted average of 4.9%. Similarly, the statistical analysis conducted on geographies consisting of 56,165,635 people shows no correlation between the proportion of Immigrants from St. Vincent and the Grenadines and unemploymnet rate among females in the United States with a correlation coefficient (R) of -0.014 and weighted average of 6.4%, a difference of 30.0%.
Female Unemployment Correlation Summary
| Measurement | Osage | Immigrants from St. Vincent and the Grenadines |
| Minimum | 1.3% | 0.80% |
| Maximum | 17.2% | 16.9% |
| Range | 15.9% | 16.1% |
| Mean | 5.5% | 5.9% |
| Median | 4.6% | 5.7% |
| Interquartile 25% (IQ1) | 3.7% | 4.4% |
| Interquartile 75% (IQ3) | 7.0% | 6.9% |
| Interquartile Range (IQR) | 3.3% | 2.5% |
| Standard Deviation (Sample) | 3.1% | 2.9% |
| Standard Deviation (Population) | 3.1% | 2.9% |
Similar Demographics by Female Unemployment
Demographics Similar to Osage by Female Unemployment
In terms of female unemployment, the demographic groups most similar to Osage are Immigrants from Ireland (4.9%, a difference of 0.040%), Tlingit-Haida (4.9%, a difference of 0.050%), Hungarian (4.9%, a difference of 0.060%), Cuban (4.9%, a difference of 0.060%), and German Russian (4.9%, a difference of 0.080%).
| Demographics | Rating | Rank | Female Unemployment |
| Immigrants | Belgium | 98.5 /100 | #63 | Exceptional 4.9% |
| Celtics | 98.5 /100 | #64 | Exceptional 4.9% |
| Immigrants | North America | 98.3 /100 | #65 | Exceptional 4.9% |
| Hungarians | 98.3 /100 | #66 | Exceptional 4.9% |
| Cubans | 98.3 /100 | #67 | Exceptional 4.9% |
| Tlingit-Haida | 98.3 /100 | #68 | Exceptional 4.9% |
| Immigrants | Ireland | 98.2 /100 | #69 | Exceptional 4.9% |
| Osage | 98.2 /100 | #70 | Exceptional 4.9% |
| German Russians | 98.1 /100 | #71 | Exceptional 4.9% |
| Immigrants | Northern Europe | 98.0 /100 | #72 | Exceptional 4.9% |
| Russians | 98.0 /100 | #73 | Exceptional 5.0% |
| Immigrants | Bolivia | 98.0 /100 | #74 | Exceptional 5.0% |
| Immigrants | Singapore | 98.0 /100 | #75 | Exceptional 5.0% |
| Immigrants | Venezuela | 97.9 /100 | #76 | Exceptional 5.0% |
| Mongolians | 97.8 /100 | #77 | Exceptional 5.0% |
Demographics Similar to Immigrants from St. Vincent and the Grenadines by Female Unemployment
In terms of female unemployment, the demographic groups most similar to Immigrants from St. Vincent and the Grenadines are British West Indian (6.4%, a difference of 0.28%), Houma (6.4%, a difference of 0.45%), Immigrants from Bangladesh (6.5%, a difference of 0.47%), Immigrants from Dominica (6.5%, a difference of 0.48%), and Pueblo (6.4%, a difference of 0.74%).
| Demographics | Rating | Rank | Female Unemployment |
| Central American Indians | 0.0 /100 | #310 | Tragic 6.3% |
| Immigrants | Mexico | 0.0 /100 | #311 | Tragic 6.3% |
| Immigrants | Grenada | 0.0 /100 | #312 | Tragic 6.3% |
| Belizeans | 0.0 /100 | #313 | Tragic 6.3% |
| Immigrants | Ecuador | 0.0 /100 | #314 | Tragic 6.4% |
| Pueblo | 0.0 /100 | #315 | Tragic 6.4% |
| Houma | 0.0 /100 | #316 | Tragic 6.4% |
| Immigrants | St. Vincent and the Grenadines | 0.0 /100 | #317 | Tragic 6.4% |
| British West Indians | 0.0 /100 | #318 | Tragic 6.4% |
| Immigrants | Bangladesh | 0.0 /100 | #319 | Tragic 6.5% |
| Immigrants | Dominica | 0.0 /100 | #320 | Tragic 6.5% |
| Blacks/African Americans | 0.0 /100 | #321 | Tragic 6.5% |
| Vietnamese | 0.0 /100 | #322 | Tragic 6.5% |
| Immigrants | Belize | 0.0 /100 | #323 | Tragic 6.5% |
| Cheyenne | 0.0 /100 | #324 | Tragic 6.6% |