Sierra Leonean vs Immigrants from Oceania Female Unemployment
COMPARE
Sierra Leonean
Immigrants from Oceania
Female Unemployment
Female Unemployment Comparison
Sierra Leoneans
Immigrants from Oceania
5.5%
FEMALE UNEMPLOYMENT
3.2/ 100
METRIC RATING
238th/ 347
METRIC RANK
5.2%
FEMALE UNEMPLOYMENT
79.5/ 100
METRIC RATING
145th/ 347
METRIC RANK
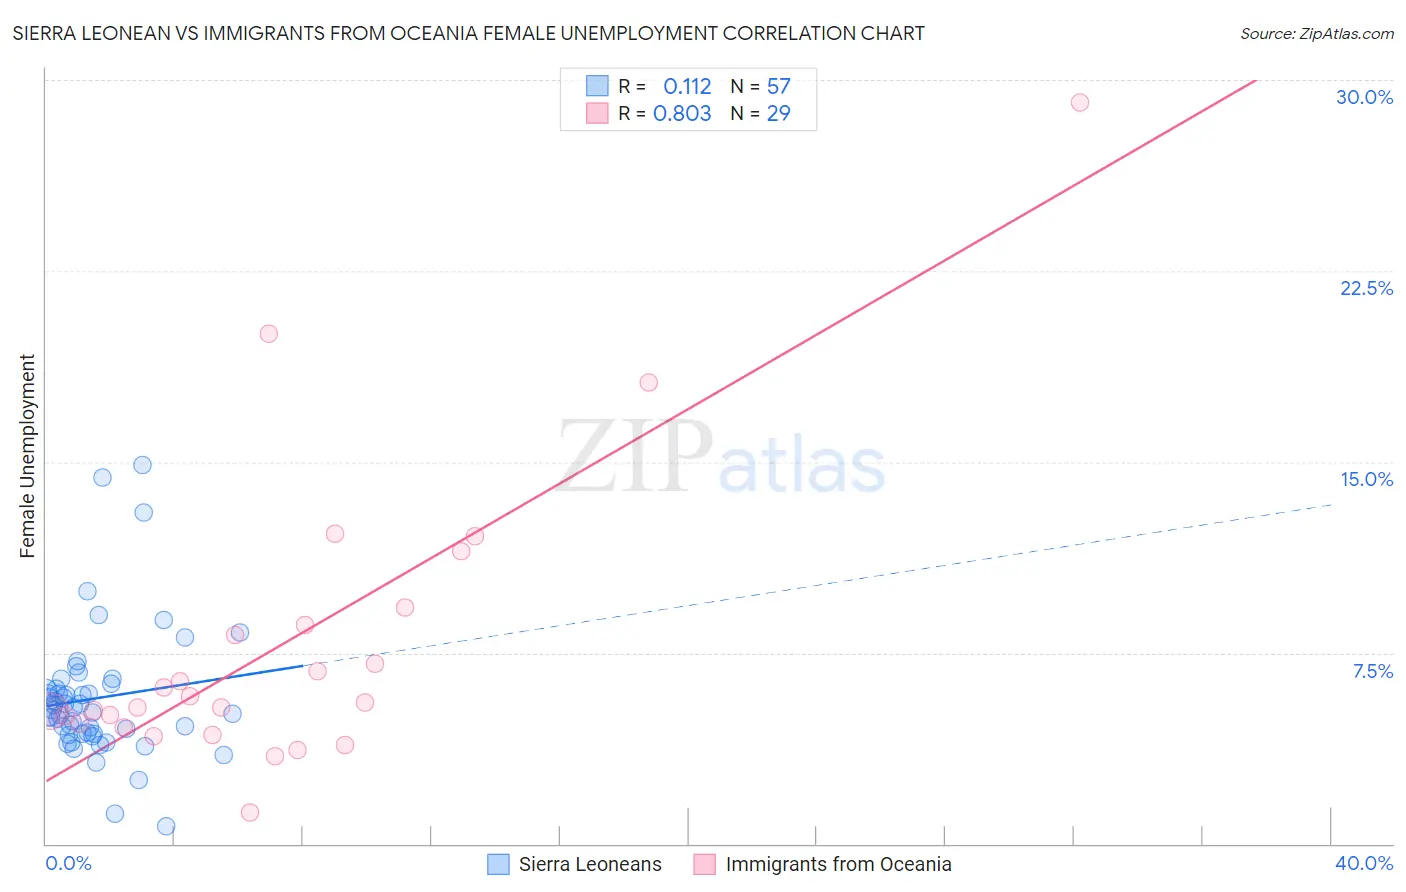
Sierra Leonean vs Immigrants from Oceania Female Unemployment Correlation Chart
The statistical analysis conducted on geographies consisting of 83,331,757 people shows a poor positive correlation between the proportion of Sierra Leoneans and unemploymnet rate among females in the United States with a correlation coefficient (R) of 0.112 and weighted average of 5.5%. Similarly, the statistical analysis conducted on geographies consisting of 304,351,716 people shows a very strong positive correlation between the proportion of Immigrants from Oceania and unemploymnet rate among females in the United States with a correlation coefficient (R) of 0.803 and weighted average of 5.2%, a difference of 7.3%.
Female Unemployment Correlation Summary
| Measurement | Sierra Leonean | Immigrants from Oceania |
| Minimum | 0.70% | 1.2% |
| Maximum | 14.9% | 29.1% |
| Range | 14.2% | 27.9% |
| Mean | 5.7% | 7.9% |
| Median | 5.2% | 5.5% |
| Interquartile 25% (IQ1) | 4.3% | 4.7% |
| Interquartile 75% (IQ3) | 6.2% | 8.9% |
| Interquartile Range (IQR) | 1.9% | 4.3% |
| Standard Deviation (Sample) | 2.6% | 5.9% |
| Standard Deviation (Population) | 2.6% | 5.8% |
Similar Demographics by Female Unemployment
Demographics Similar to Sierra Leoneans by Female Unemployment
In terms of female unemployment, the demographic groups most similar to Sierra Leoneans are Immigrants from Panama (5.5%, a difference of 0.020%), Immigrants from Cambodia (5.5%, a difference of 0.040%), Immigrants from Lebanon (5.5%, a difference of 0.080%), Immigrants from Iran (5.5%, a difference of 0.080%), and Moroccan (5.5%, a difference of 0.10%).
| Demographics | Rating | Rank | Female Unemployment |
| Immigrants | Iraq | 3.9 /100 | #231 | Tragic 5.5% |
| Liberians | 3.9 /100 | #232 | Tragic 5.5% |
| Moroccans | 3.4 /100 | #233 | Tragic 5.5% |
| Immigrants | Lebanon | 3.3 /100 | #234 | Tragic 5.5% |
| Immigrants | Iran | 3.3 /100 | #235 | Tragic 5.5% |
| Immigrants | Cambodia | 3.3 /100 | #236 | Tragic 5.5% |
| Immigrants | Panama | 3.2 /100 | #237 | Tragic 5.5% |
| Sierra Leoneans | 3.2 /100 | #238 | Tragic 5.5% |
| Aleuts | 3.0 /100 | #239 | Tragic 5.5% |
| Immigrants | South America | 2.9 /100 | #240 | Tragic 5.5% |
| South American Indians | 2.8 /100 | #241 | Tragic 5.5% |
| Marshallese | 2.3 /100 | #242 | Tragic 5.6% |
| Spanish Americans | 2.2 /100 | #243 | Tragic 5.6% |
| Immigrants | Liberia | 1.5 /100 | #244 | Tragic 5.6% |
| Guamanians/Chamorros | 1.4 /100 | #245 | Tragic 5.6% |
Demographics Similar to Immigrants from Oceania by Female Unemployment
In terms of female unemployment, the demographic groups most similar to Immigrants from Oceania are Immigrants from Norway (5.2%, a difference of 0.010%), Argentinean (5.2%, a difference of 0.030%), Immigrants from Argentina (5.2%, a difference of 0.070%), Immigrants from Jordan (5.1%, a difference of 0.090%), and Asian (5.2%, a difference of 0.11%).
| Demographics | Rating | Rank | Female Unemployment |
| Chickasaw | 83.2 /100 | #138 | Excellent 5.1% |
| Immigrants | Eastern Asia | 83.0 /100 | #139 | Excellent 5.1% |
| Immigrants | France | 82.7 /100 | #140 | Excellent 5.1% |
| Immigrants | Eastern Europe | 81.5 /100 | #141 | Excellent 5.1% |
| Palestinians | 80.8 /100 | #142 | Excellent 5.1% |
| Immigrants | Kazakhstan | 80.7 /100 | #143 | Excellent 5.1% |
| Immigrants | Jordan | 80.4 /100 | #144 | Excellent 5.1% |
| Immigrants | Oceania | 79.5 /100 | #145 | Good 5.2% |
| Immigrants | Norway | 79.4 /100 | #146 | Good 5.2% |
| Argentineans | 79.2 /100 | #147 | Good 5.2% |
| Immigrants | Argentina | 78.7 /100 | #148 | Good 5.2% |
| Asians | 78.3 /100 | #149 | Good 5.2% |
| Egyptians | 78.3 /100 | #150 | Good 5.2% |
| Immigrants | China | 75.9 /100 | #151 | Good 5.2% |
| Immigrants | Italy | 75.0 /100 | #152 | Good 5.2% |