Filipino vs Immigrants from Oceania Female Unemployment
COMPARE
Filipino
Immigrants from Oceania
Female Unemployment
Female Unemployment Comparison
Filipinos
Immigrants from Oceania
5.0%
FEMALE UNEMPLOYMENT
97.3/ 100
METRIC RATING
81st/ 347
METRIC RANK
5.2%
FEMALE UNEMPLOYMENT
79.5/ 100
METRIC RATING
145th/ 347
METRIC RANK
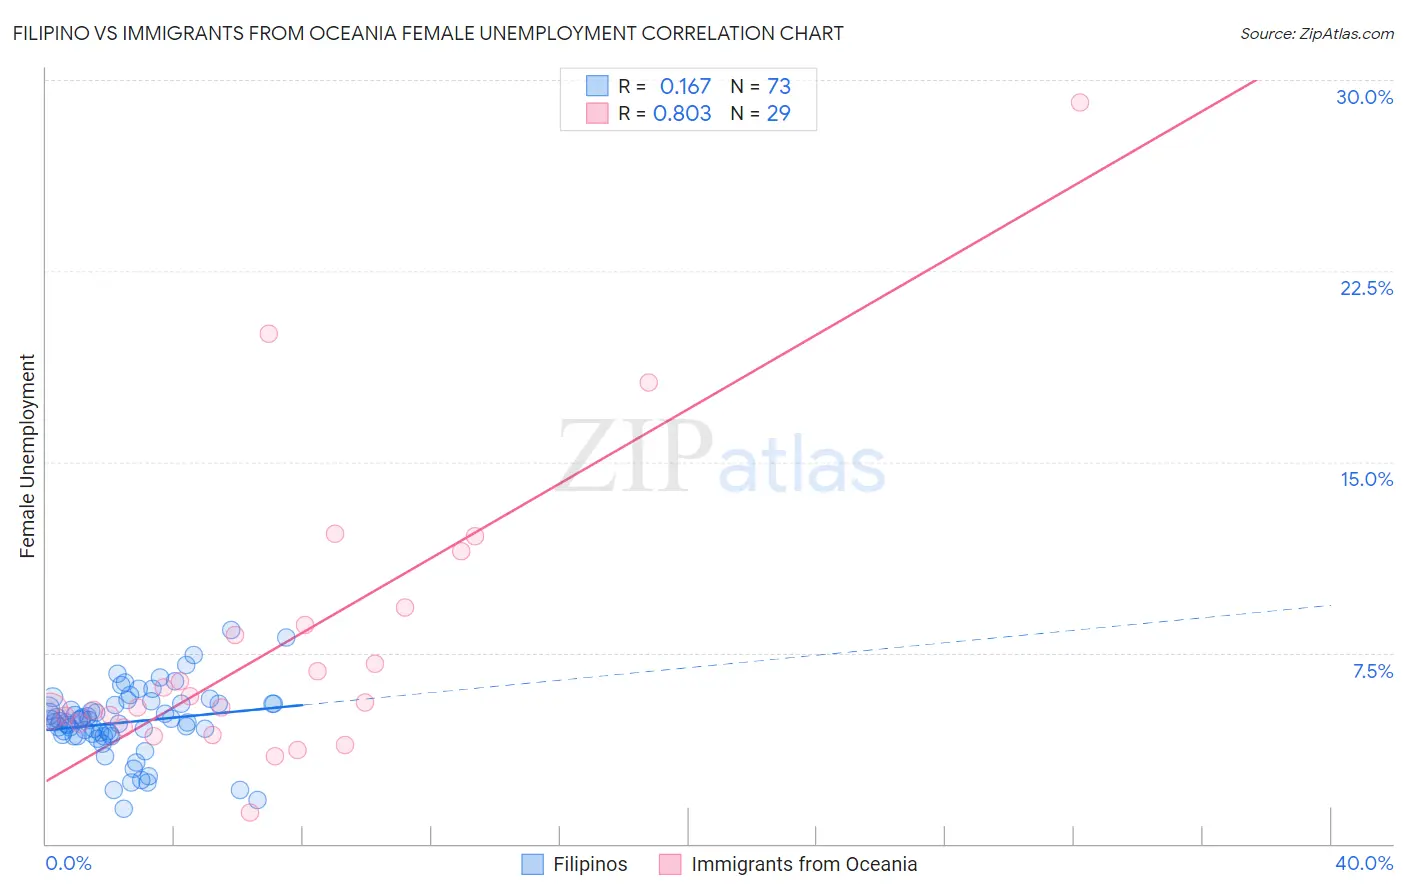
Filipino vs Immigrants from Oceania Female Unemployment Correlation Chart
The statistical analysis conducted on geographies consisting of 253,878,439 people shows a poor positive correlation between the proportion of Filipinos and unemploymnet rate among females in the United States with a correlation coefficient (R) of 0.167 and weighted average of 5.0%. Similarly, the statistical analysis conducted on geographies consisting of 304,351,716 people shows a very strong positive correlation between the proportion of Immigrants from Oceania and unemploymnet rate among females in the United States with a correlation coefficient (R) of 0.803 and weighted average of 5.2%, a difference of 3.6%.
Female Unemployment Correlation Summary
| Measurement | Filipino | Immigrants from Oceania |
| Minimum | 1.4% | 1.2% |
| Maximum | 8.4% | 29.1% |
| Range | 7.0% | 27.9% |
| Mean | 4.8% | 7.9% |
| Median | 4.8% | 5.5% |
| Interquartile 25% (IQ1) | 4.3% | 4.7% |
| Interquartile 75% (IQ3) | 5.5% | 8.9% |
| Interquartile Range (IQR) | 1.2% | 4.3% |
| Standard Deviation (Sample) | 1.3% | 5.9% |
| Standard Deviation (Population) | 1.3% | 5.8% |
Similar Demographics by Female Unemployment
Demographics Similar to Filipinos by Female Unemployment
In terms of female unemployment, the demographic groups most similar to Filipinos are New Zealander (5.0%, a difference of 0.020%), Immigrants from Australia (5.0%, a difference of 0.050%), Immigrants from Serbia (5.0%, a difference of 0.070%), Canadian (5.0%, a difference of 0.10%), and Turkish (5.0%, a difference of 0.14%).
| Demographics | Rating | Rank | Female Unemployment |
| Immigrants | Bolivia | 98.0 /100 | #74 | Exceptional 5.0% |
| Immigrants | Singapore | 98.0 /100 | #75 | Exceptional 5.0% |
| Immigrants | Venezuela | 97.9 /100 | #76 | Exceptional 5.0% |
| Mongolians | 97.8 /100 | #77 | Exceptional 5.0% |
| Immigrants | Netherlands | 97.8 /100 | #78 | Exceptional 5.0% |
| Turks | 97.6 /100 | #79 | Exceptional 5.0% |
| New Zealanders | 97.4 /100 | #80 | Exceptional 5.0% |
| Filipinos | 97.3 /100 | #81 | Exceptional 5.0% |
| Immigrants | Australia | 97.3 /100 | #82 | Exceptional 5.0% |
| Immigrants | Serbia | 97.2 /100 | #83 | Exceptional 5.0% |
| Canadians | 97.2 /100 | #84 | Exceptional 5.0% |
| Ukrainians | 97.1 /100 | #85 | Exceptional 5.0% |
| Bolivians | 97.1 /100 | #86 | Exceptional 5.0% |
| Venezuelans | 96.9 /100 | #87 | Exceptional 5.0% |
| Immigrants | Sudan | 96.7 /100 | #88 | Exceptional 5.0% |
Demographics Similar to Immigrants from Oceania by Female Unemployment
In terms of female unemployment, the demographic groups most similar to Immigrants from Oceania are Immigrants from Norway (5.2%, a difference of 0.010%), Argentinean (5.2%, a difference of 0.030%), Immigrants from Argentina (5.2%, a difference of 0.070%), Immigrants from Jordan (5.1%, a difference of 0.090%), and Asian (5.2%, a difference of 0.11%).
| Demographics | Rating | Rank | Female Unemployment |
| Chickasaw | 83.2 /100 | #138 | Excellent 5.1% |
| Immigrants | Eastern Asia | 83.0 /100 | #139 | Excellent 5.1% |
| Immigrants | France | 82.7 /100 | #140 | Excellent 5.1% |
| Immigrants | Eastern Europe | 81.5 /100 | #141 | Excellent 5.1% |
| Palestinians | 80.8 /100 | #142 | Excellent 5.1% |
| Immigrants | Kazakhstan | 80.7 /100 | #143 | Excellent 5.1% |
| Immigrants | Jordan | 80.4 /100 | #144 | Excellent 5.1% |
| Immigrants | Oceania | 79.5 /100 | #145 | Good 5.2% |
| Immigrants | Norway | 79.4 /100 | #146 | Good 5.2% |
| Argentineans | 79.2 /100 | #147 | Good 5.2% |
| Immigrants | Argentina | 78.7 /100 | #148 | Good 5.2% |
| Asians | 78.3 /100 | #149 | Good 5.2% |
| Egyptians | 78.3 /100 | #150 | Good 5.2% |
| Immigrants | China | 75.9 /100 | #151 | Good 5.2% |
| Immigrants | Italy | 75.0 /100 | #152 | Good 5.2% |