Osage vs Liberian Female Unemployment
COMPARE
Osage
Liberian
Female Unemployment
Female Unemployment Comparison
Osage
Liberians
4.9%
FEMALE UNEMPLOYMENT
98.2/ 100
METRIC RATING
70th/ 347
METRIC RANK
5.5%
FEMALE UNEMPLOYMENT
3.9/ 100
METRIC RATING
232nd/ 347
METRIC RANK
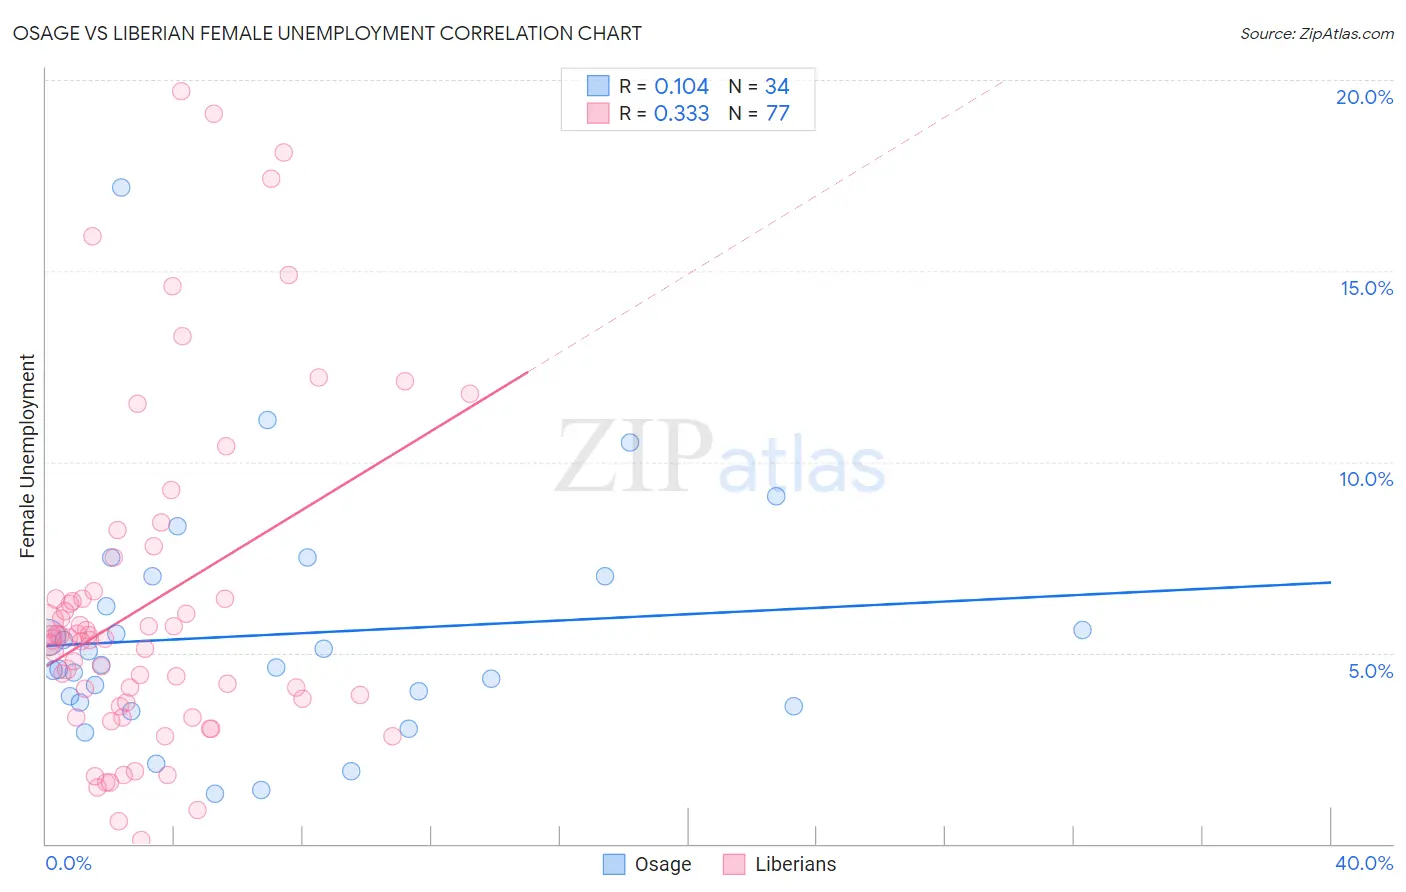
Osage vs Liberian Female Unemployment Correlation Chart
The statistical analysis conducted on geographies consisting of 91,544,897 people shows a poor positive correlation between the proportion of Osage and unemploymnet rate among females in the United States with a correlation coefficient (R) of 0.104 and weighted average of 4.9%. Similarly, the statistical analysis conducted on geographies consisting of 117,959,005 people shows a mild positive correlation between the proportion of Liberians and unemploymnet rate among females in the United States with a correlation coefficient (R) of 0.333 and weighted average of 5.5%, a difference of 11.5%.
Female Unemployment Correlation Summary
| Measurement | Osage | Liberian |
| Minimum | 1.3% | 0.10% |
| Maximum | 17.2% | 19.7% |
| Range | 15.9% | 19.6% |
| Mean | 5.5% | 6.3% |
| Median | 4.6% | 5.4% |
| Interquartile 25% (IQ1) | 3.7% | 3.6% |
| Interquartile 75% (IQ3) | 7.0% | 6.5% |
| Interquartile Range (IQR) | 3.3% | 2.9% |
| Standard Deviation (Sample) | 3.1% | 4.4% |
| Standard Deviation (Population) | 3.1% | 4.4% |
Similar Demographics by Female Unemployment
Demographics Similar to Osage by Female Unemployment
In terms of female unemployment, the demographic groups most similar to Osage are Immigrants from Ireland (4.9%, a difference of 0.040%), Tlingit-Haida (4.9%, a difference of 0.050%), Hungarian (4.9%, a difference of 0.060%), Cuban (4.9%, a difference of 0.060%), and German Russian (4.9%, a difference of 0.080%).
| Demographics | Rating | Rank | Female Unemployment |
| Immigrants | Belgium | 98.5 /100 | #63 | Exceptional 4.9% |
| Celtics | 98.5 /100 | #64 | Exceptional 4.9% |
| Immigrants | North America | 98.3 /100 | #65 | Exceptional 4.9% |
| Hungarians | 98.3 /100 | #66 | Exceptional 4.9% |
| Cubans | 98.3 /100 | #67 | Exceptional 4.9% |
| Tlingit-Haida | 98.3 /100 | #68 | Exceptional 4.9% |
| Immigrants | Ireland | 98.2 /100 | #69 | Exceptional 4.9% |
| Osage | 98.2 /100 | #70 | Exceptional 4.9% |
| German Russians | 98.1 /100 | #71 | Exceptional 4.9% |
| Immigrants | Northern Europe | 98.0 /100 | #72 | Exceptional 4.9% |
| Russians | 98.0 /100 | #73 | Exceptional 5.0% |
| Immigrants | Bolivia | 98.0 /100 | #74 | Exceptional 5.0% |
| Immigrants | Singapore | 98.0 /100 | #75 | Exceptional 5.0% |
| Immigrants | Venezuela | 97.9 /100 | #76 | Exceptional 5.0% |
| Mongolians | 97.8 /100 | #77 | Exceptional 5.0% |
Demographics Similar to Liberians by Female Unemployment
In terms of female unemployment, the demographic groups most similar to Liberians are Immigrants from Iraq (5.5%, a difference of 0.010%), Moroccan (5.5%, a difference of 0.21%), Immigrants from Lebanon (5.5%, a difference of 0.23%), Immigrants from Iran (5.5%, a difference of 0.23%), and Immigrants from Cambodia (5.5%, a difference of 0.27%).
| Demographics | Rating | Rank | Female Unemployment |
| French American Indians | 6.1 /100 | #225 | Tragic 5.5% |
| Immigrants | Peru | 5.9 /100 | #226 | Tragic 5.5% |
| Immigrants | Philippines | 5.3 /100 | #227 | Tragic 5.5% |
| Israelis | 4.8 /100 | #228 | Tragic 5.5% |
| Panamanians | 4.7 /100 | #229 | Tragic 5.5% |
| Immigrants | Uruguay | 4.7 /100 | #230 | Tragic 5.5% |
| Immigrants | Iraq | 3.9 /100 | #231 | Tragic 5.5% |
| Liberians | 3.9 /100 | #232 | Tragic 5.5% |
| Moroccans | 3.4 /100 | #233 | Tragic 5.5% |
| Immigrants | Lebanon | 3.3 /100 | #234 | Tragic 5.5% |
| Immigrants | Iran | 3.3 /100 | #235 | Tragic 5.5% |
| Immigrants | Cambodia | 3.3 /100 | #236 | Tragic 5.5% |
| Immigrants | Panama | 3.2 /100 | #237 | Tragic 5.5% |
| Sierra Leoneans | 3.2 /100 | #238 | Tragic 5.5% |
| Aleuts | 3.0 /100 | #239 | Tragic 5.5% |