Immigrants from Pakistan vs Immigrants from Oceania Female Unemployment
COMPARE
Immigrants from Pakistan
Immigrants from Oceania
Female Unemployment
Female Unemployment Comparison
Immigrants from Pakistan
Immigrants from Oceania
5.2%
FEMALE UNEMPLOYMENT
66.7/ 100
METRIC RATING
161st/ 347
METRIC RANK
5.2%
FEMALE UNEMPLOYMENT
79.5/ 100
METRIC RATING
145th/ 347
METRIC RANK
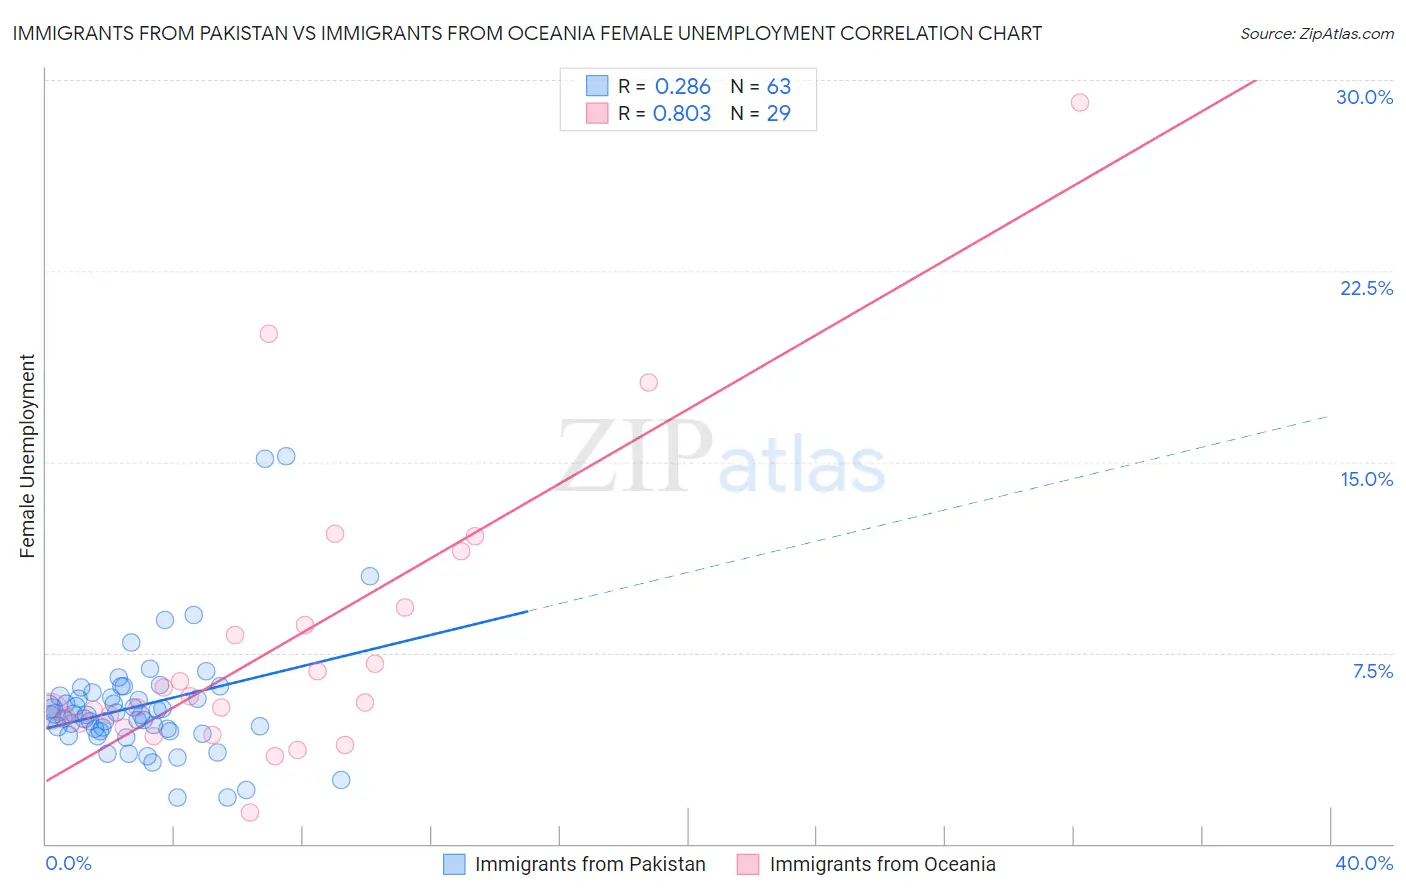
Immigrants from Pakistan vs Immigrants from Oceania Female Unemployment Correlation Chart
The statistical analysis conducted on geographies consisting of 283,425,131 people shows a weak positive correlation between the proportion of Immigrants from Pakistan and unemploymnet rate among females in the United States with a correlation coefficient (R) of 0.286 and weighted average of 5.2%. Similarly, the statistical analysis conducted on geographies consisting of 304,351,716 people shows a very strong positive correlation between the proportion of Immigrants from Oceania and unemploymnet rate among females in the United States with a correlation coefficient (R) of 0.803 and weighted average of 5.2%, a difference of 1.0%.
Female Unemployment Correlation Summary
| Measurement | Immigrants from Pakistan | Immigrants from Oceania |
| Minimum | 1.8% | 1.2% |
| Maximum | 15.2% | 29.1% |
| Range | 13.4% | 27.9% |
| Mean | 5.4% | 7.9% |
| Median | 5.0% | 5.5% |
| Interquartile 25% (IQ1) | 4.4% | 4.7% |
| Interquartile 75% (IQ3) | 5.8% | 8.9% |
| Interquartile Range (IQR) | 1.4% | 4.3% |
| Standard Deviation (Sample) | 2.3% | 5.9% |
| Standard Deviation (Population) | 2.3% | 5.8% |
Demographics Similar to Immigrants from Pakistan and Immigrants from Oceania by Female Unemployment
In terms of female unemployment, the demographic groups most similar to Immigrants from Pakistan are Immigrants from Spain (5.2%, a difference of 0.0%), Immigrants from Micronesia (5.2%, a difference of 0.010%), Potawatomi (5.2%, a difference of 0.050%), Albanian (5.2%, a difference of 0.11%), and Immigrants from Asia (5.2%, a difference of 0.16%). Similarly, the demographic groups most similar to Immigrants from Oceania are Immigrants from Norway (5.2%, a difference of 0.010%), Argentinean (5.2%, a difference of 0.030%), Immigrants from Argentina (5.2%, a difference of 0.070%), Immigrants from Jordan (5.1%, a difference of 0.090%), and Asian (5.2%, a difference of 0.11%).
| Demographics | Rating | Rank | Female Unemployment |
| Immigrants | Kazakhstan | 80.7 /100 | #143 | Excellent 5.1% |
| Immigrants | Jordan | 80.4 /100 | #144 | Excellent 5.1% |
| Immigrants | Oceania | 79.5 /100 | #145 | Good 5.2% |
| Immigrants | Norway | 79.4 /100 | #146 | Good 5.2% |
| Argentineans | 79.2 /100 | #147 | Good 5.2% |
| Immigrants | Argentina | 78.7 /100 | #148 | Good 5.2% |
| Asians | 78.3 /100 | #149 | Good 5.2% |
| Egyptians | 78.3 /100 | #150 | Good 5.2% |
| Immigrants | China | 75.9 /100 | #151 | Good 5.2% |
| Immigrants | Italy | 75.0 /100 | #152 | Good 5.2% |
| Immigrants | Greece | 74.9 /100 | #153 | Good 5.2% |
| South Africans | 70.8 /100 | #154 | Good 5.2% |
| Immigrants | Egypt | 70.0 /100 | #155 | Good 5.2% |
| Immigrants | Northern Africa | 69.6 /100 | #156 | Good 5.2% |
| Immigrants | Russia | 69.3 /100 | #157 | Good 5.2% |
| Albanians | 68.3 /100 | #158 | Good 5.2% |
| Immigrants | Micronesia | 66.9 /100 | #159 | Good 5.2% |
| Immigrants | Spain | 66.8 /100 | #160 | Good 5.2% |
| Immigrants | Pakistan | 66.7 /100 | #161 | Good 5.2% |
| Potawatomi | 65.9 /100 | #162 | Good 5.2% |
| Immigrants | Asia | 64.3 /100 | #163 | Good 5.2% |