Laotian vs Immigrants from Oceania Female Unemployment
COMPARE
Laotian
Immigrants from Oceania
Female Unemployment
Female Unemployment Comparison
Laotians
Immigrants from Oceania
5.3%
FEMALE UNEMPLOYMENT
45.1/ 100
METRIC RATING
179th/ 347
METRIC RANK
5.2%
FEMALE UNEMPLOYMENT
79.5/ 100
METRIC RATING
145th/ 347
METRIC RANK
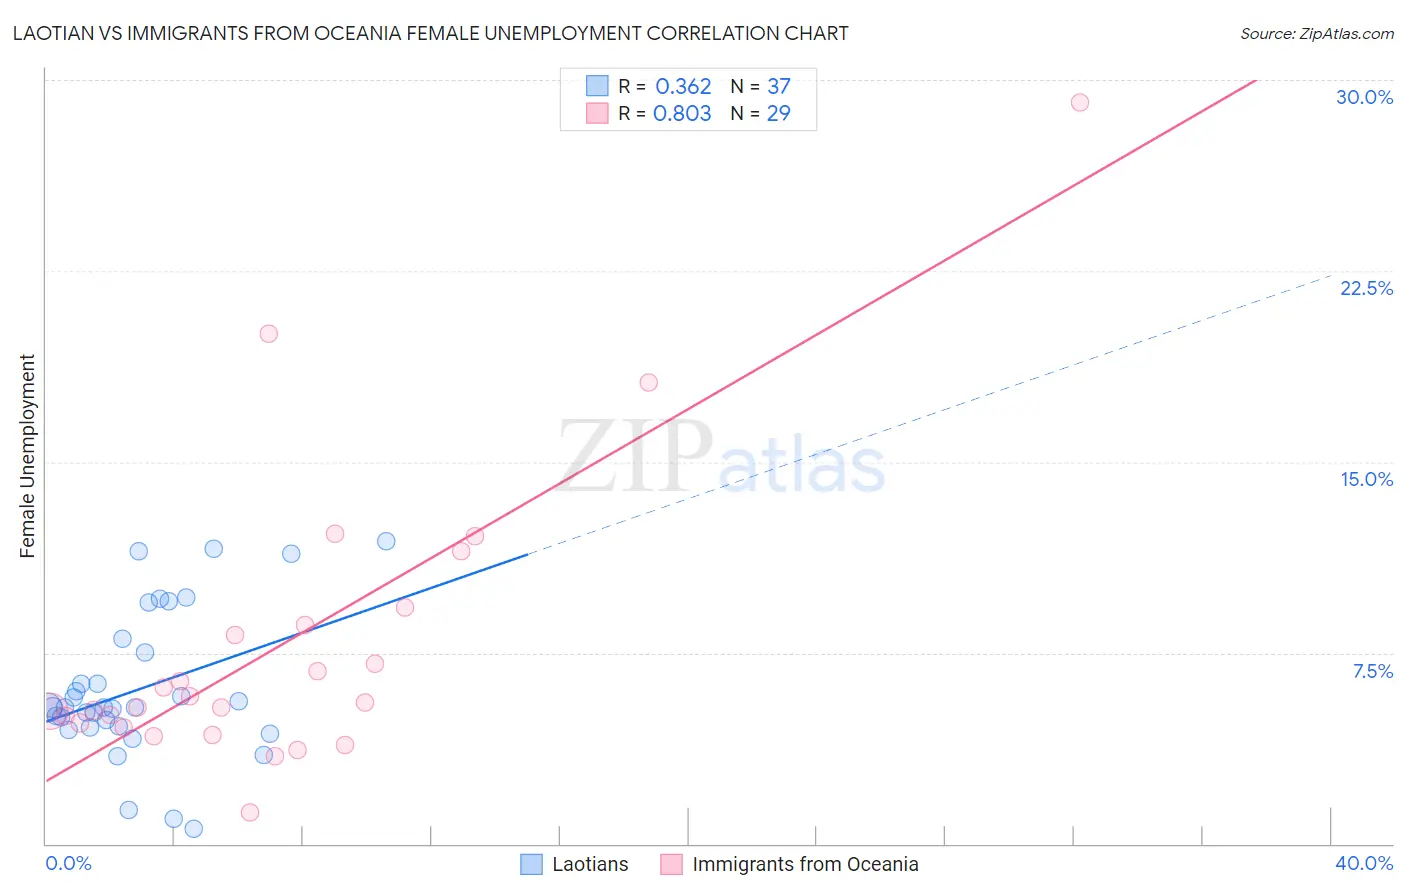
Laotian vs Immigrants from Oceania Female Unemployment Correlation Chart
The statistical analysis conducted on geographies consisting of 224,555,281 people shows a mild positive correlation between the proportion of Laotians and unemploymnet rate among females in the United States with a correlation coefficient (R) of 0.362 and weighted average of 5.3%. Similarly, the statistical analysis conducted on geographies consisting of 304,351,716 people shows a very strong positive correlation between the proportion of Immigrants from Oceania and unemploymnet rate among females in the United States with a correlation coefficient (R) of 0.803 and weighted average of 5.2%, a difference of 2.4%.
Female Unemployment Correlation Summary
| Measurement | Laotian | Immigrants from Oceania |
| Minimum | 0.60% | 1.2% |
| Maximum | 11.9% | 29.1% |
| Range | 11.3% | 27.9% |
| Mean | 6.1% | 7.9% |
| Median | 5.4% | 5.5% |
| Interquartile 25% (IQ1) | 4.6% | 4.7% |
| Interquartile 75% (IQ3) | 7.8% | 8.9% |
| Interquartile Range (IQR) | 3.2% | 4.3% |
| Standard Deviation (Sample) | 2.9% | 5.9% |
| Standard Deviation (Population) | 2.8% | 5.8% |
Similar Demographics by Female Unemployment
Demographics Similar to Laotians by Female Unemployment
In terms of female unemployment, the demographic groups most similar to Laotians are Immigrants from Southern Europe (5.3%, a difference of 0.070%), Immigrants from Congo (5.3%, a difference of 0.12%), Immigrants from Vietnam (5.3%, a difference of 0.14%), Immigrants from Morocco (5.3%, a difference of 0.14%), and Taiwanese (5.3%, a difference of 0.14%).
| Demographics | Rating | Rank | Female Unemployment |
| Immigrants | Uganda | 50.7 /100 | #172 | Average 5.3% |
| Iranians | 50.4 /100 | #173 | Average 5.3% |
| Immigrants | Poland | 50.0 /100 | #174 | Average 5.3% |
| Immigrants | Laos | 47.5 /100 | #175 | Average 5.3% |
| Immigrants | Vietnam | 47.5 /100 | #176 | Average 5.3% |
| Immigrants | Morocco | 47.4 /100 | #177 | Average 5.3% |
| Immigrants | Southern Europe | 46.2 /100 | #178 | Average 5.3% |
| Laotians | 45.1 /100 | #179 | Average 5.3% |
| Immigrants | Congo | 43.1 /100 | #180 | Average 5.3% |
| Taiwanese | 42.7 /100 | #181 | Average 5.3% |
| Immigrants | Nonimmigrants | 42.6 /100 | #182 | Average 5.3% |
| Immigrants | Indonesia | 40.7 /100 | #183 | Average 5.3% |
| Immigrants | Ukraine | 40.1 /100 | #184 | Average 5.3% |
| Malaysians | 40.1 /100 | #185 | Average 5.3% |
| Immigrants | Belarus | 39.4 /100 | #186 | Fair 5.3% |
Demographics Similar to Immigrants from Oceania by Female Unemployment
In terms of female unemployment, the demographic groups most similar to Immigrants from Oceania are Immigrants from Norway (5.2%, a difference of 0.010%), Argentinean (5.2%, a difference of 0.030%), Immigrants from Argentina (5.2%, a difference of 0.070%), Immigrants from Jordan (5.1%, a difference of 0.090%), and Asian (5.2%, a difference of 0.11%).
| Demographics | Rating | Rank | Female Unemployment |
| Chickasaw | 83.2 /100 | #138 | Excellent 5.1% |
| Immigrants | Eastern Asia | 83.0 /100 | #139 | Excellent 5.1% |
| Immigrants | France | 82.7 /100 | #140 | Excellent 5.1% |
| Immigrants | Eastern Europe | 81.5 /100 | #141 | Excellent 5.1% |
| Palestinians | 80.8 /100 | #142 | Excellent 5.1% |
| Immigrants | Kazakhstan | 80.7 /100 | #143 | Excellent 5.1% |
| Immigrants | Jordan | 80.4 /100 | #144 | Excellent 5.1% |
| Immigrants | Oceania | 79.5 /100 | #145 | Good 5.2% |
| Immigrants | Norway | 79.4 /100 | #146 | Good 5.2% |
| Argentineans | 79.2 /100 | #147 | Good 5.2% |
| Immigrants | Argentina | 78.7 /100 | #148 | Good 5.2% |
| Asians | 78.3 /100 | #149 | Good 5.2% |
| Egyptians | 78.3 /100 | #150 | Good 5.2% |
| Immigrants | China | 75.9 /100 | #151 | Good 5.2% |
| Immigrants | Italy | 75.0 /100 | #152 | Good 5.2% |