Laotian vs Immigrants from Jamaica Female Unemployment
COMPARE
Laotian
Immigrants from Jamaica
Female Unemployment
Female Unemployment Comparison
Laotians
Immigrants from Jamaica
5.3%
FEMALE UNEMPLOYMENT
45.1/ 100
METRIC RATING
179th/ 347
METRIC RANK
6.2%
FEMALE UNEMPLOYMENT
0.0/ 100
METRIC RATING
304th/ 347
METRIC RANK
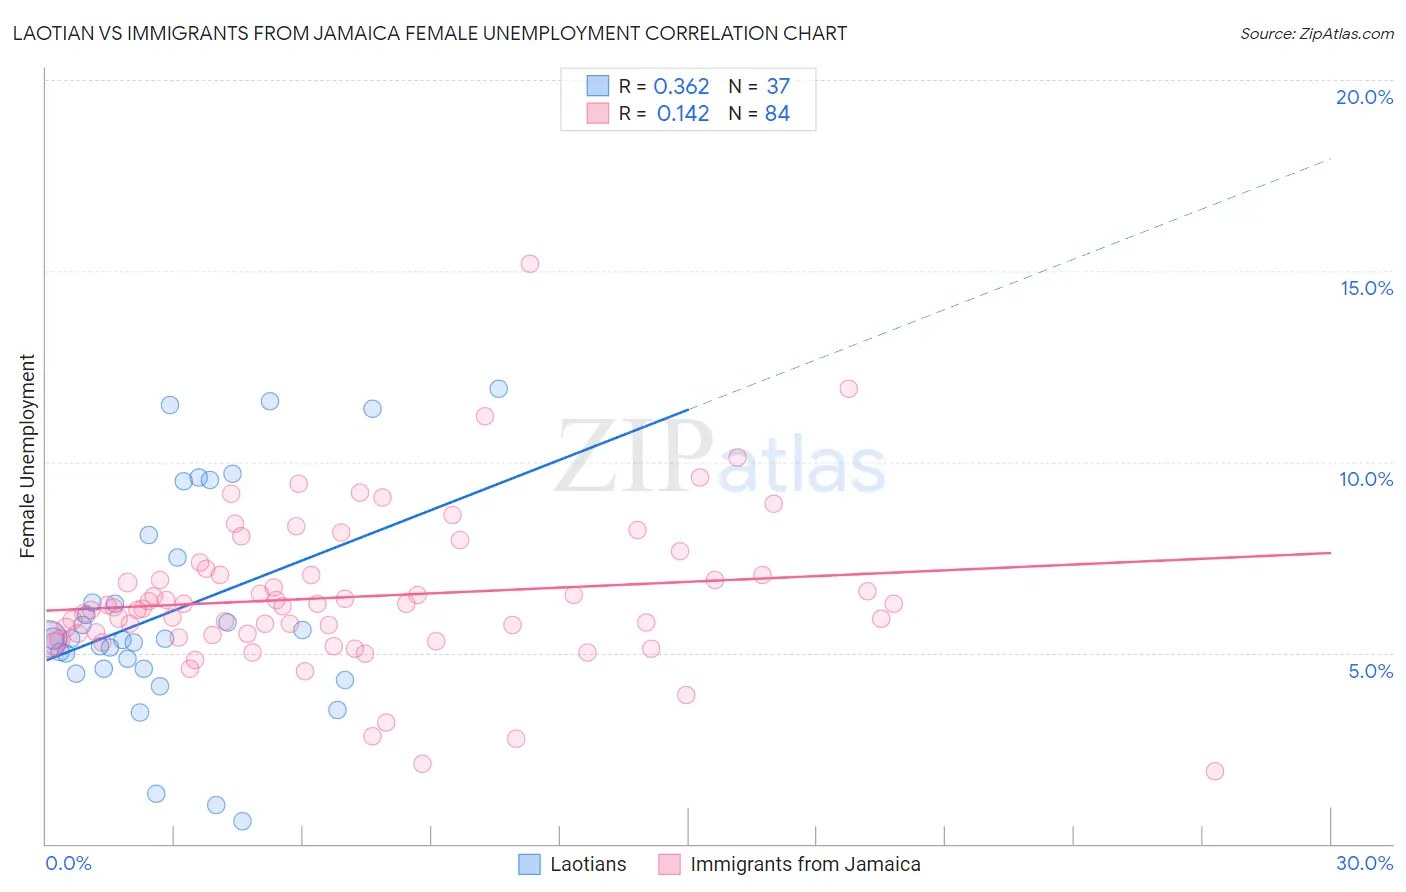
Laotian vs Immigrants from Jamaica Female Unemployment Correlation Chart
The statistical analysis conducted on geographies consisting of 224,555,281 people shows a mild positive correlation between the proportion of Laotians and unemploymnet rate among females in the United States with a correlation coefficient (R) of 0.362 and weighted average of 5.3%. Similarly, the statistical analysis conducted on geographies consisting of 300,910,476 people shows a poor positive correlation between the proportion of Immigrants from Jamaica and unemploymnet rate among females in the United States with a correlation coefficient (R) of 0.142 and weighted average of 6.2%, a difference of 17.8%.
Female Unemployment Correlation Summary
| Measurement | Laotian | Immigrants from Jamaica |
| Minimum | 0.60% | 1.9% |
| Maximum | 11.9% | 15.2% |
| Range | 11.3% | 13.3% |
| Mean | 6.1% | 6.5% |
| Median | 5.4% | 6.2% |
| Interquartile 25% (IQ1) | 4.6% | 5.4% |
| Interquartile 75% (IQ3) | 7.8% | 7.0% |
| Interquartile Range (IQR) | 3.2% | 1.6% |
| Standard Deviation (Sample) | 2.9% | 2.0% |
| Standard Deviation (Population) | 2.8% | 2.0% |
Similar Demographics by Female Unemployment
Demographics Similar to Laotians by Female Unemployment
In terms of female unemployment, the demographic groups most similar to Laotians are Immigrants from Southern Europe (5.3%, a difference of 0.070%), Immigrants from Congo (5.3%, a difference of 0.12%), Immigrants from Vietnam (5.3%, a difference of 0.14%), Immigrants from Morocco (5.3%, a difference of 0.14%), and Taiwanese (5.3%, a difference of 0.14%).
| Demographics | Rating | Rank | Female Unemployment |
| Immigrants | Uganda | 50.7 /100 | #172 | Average 5.3% |
| Iranians | 50.4 /100 | #173 | Average 5.3% |
| Immigrants | Poland | 50.0 /100 | #174 | Average 5.3% |
| Immigrants | Laos | 47.5 /100 | #175 | Average 5.3% |
| Immigrants | Vietnam | 47.5 /100 | #176 | Average 5.3% |
| Immigrants | Morocco | 47.4 /100 | #177 | Average 5.3% |
| Immigrants | Southern Europe | 46.2 /100 | #178 | Average 5.3% |
| Laotians | 45.1 /100 | #179 | Average 5.3% |
| Immigrants | Congo | 43.1 /100 | #180 | Average 5.3% |
| Taiwanese | 42.7 /100 | #181 | Average 5.3% |
| Immigrants | Nonimmigrants | 42.6 /100 | #182 | Average 5.3% |
| Immigrants | Indonesia | 40.7 /100 | #183 | Average 5.3% |
| Immigrants | Ukraine | 40.1 /100 | #184 | Average 5.3% |
| Malaysians | 40.1 /100 | #185 | Average 5.3% |
| Immigrants | Belarus | 39.4 /100 | #186 | Fair 5.3% |
Demographics Similar to Immigrants from Jamaica by Female Unemployment
In terms of female unemployment, the demographic groups most similar to Immigrants from Jamaica are Spanish American Indian (6.2%, a difference of 0.060%), Immigrants from Central America (6.2%, a difference of 0.21%), Shoshone (6.2%, a difference of 0.23%), Hispanic or Latino (6.2%, a difference of 0.29%), and Barbadian (6.2%, a difference of 0.37%).
| Demographics | Rating | Rank | Female Unemployment |
| West Indians | 0.0 /100 | #297 | Tragic 6.1% |
| Jamaicans | 0.0 /100 | #298 | Tragic 6.1% |
| Ute | 0.0 /100 | #299 | Tragic 6.1% |
| Immigrants | Haiti | 0.0 /100 | #300 | Tragic 6.1% |
| Immigrants | Barbados | 0.0 /100 | #301 | Tragic 6.2% |
| U.S. Virgin Islanders | 0.0 /100 | #302 | Tragic 6.2% |
| Barbadians | 0.0 /100 | #303 | Tragic 6.2% |
| Immigrants | Jamaica | 0.0 /100 | #304 | Tragic 6.2% |
| Spanish American Indians | 0.0 /100 | #305 | Tragic 6.2% |
| Immigrants | Central America | 0.0 /100 | #306 | Tragic 6.2% |
| Shoshone | 0.0 /100 | #307 | Tragic 6.2% |
| Hispanics or Latinos | 0.0 /100 | #308 | Tragic 6.2% |
| Ecuadorians | 0.0 /100 | #309 | Tragic 6.3% |
| Central American Indians | 0.0 /100 | #310 | Tragic 6.3% |
| Immigrants | Mexico | 0.0 /100 | #311 | Tragic 6.3% |