Laotian vs Immigrants from Micronesia Female Unemployment
COMPARE
Laotian
Immigrants from Micronesia
Female Unemployment
Female Unemployment Comparison
Laotians
Immigrants from Micronesia
5.3%
FEMALE UNEMPLOYMENT
45.1/ 100
METRIC RATING
179th/ 347
METRIC RANK
5.2%
FEMALE UNEMPLOYMENT
66.9/ 100
METRIC RATING
159th/ 347
METRIC RANK
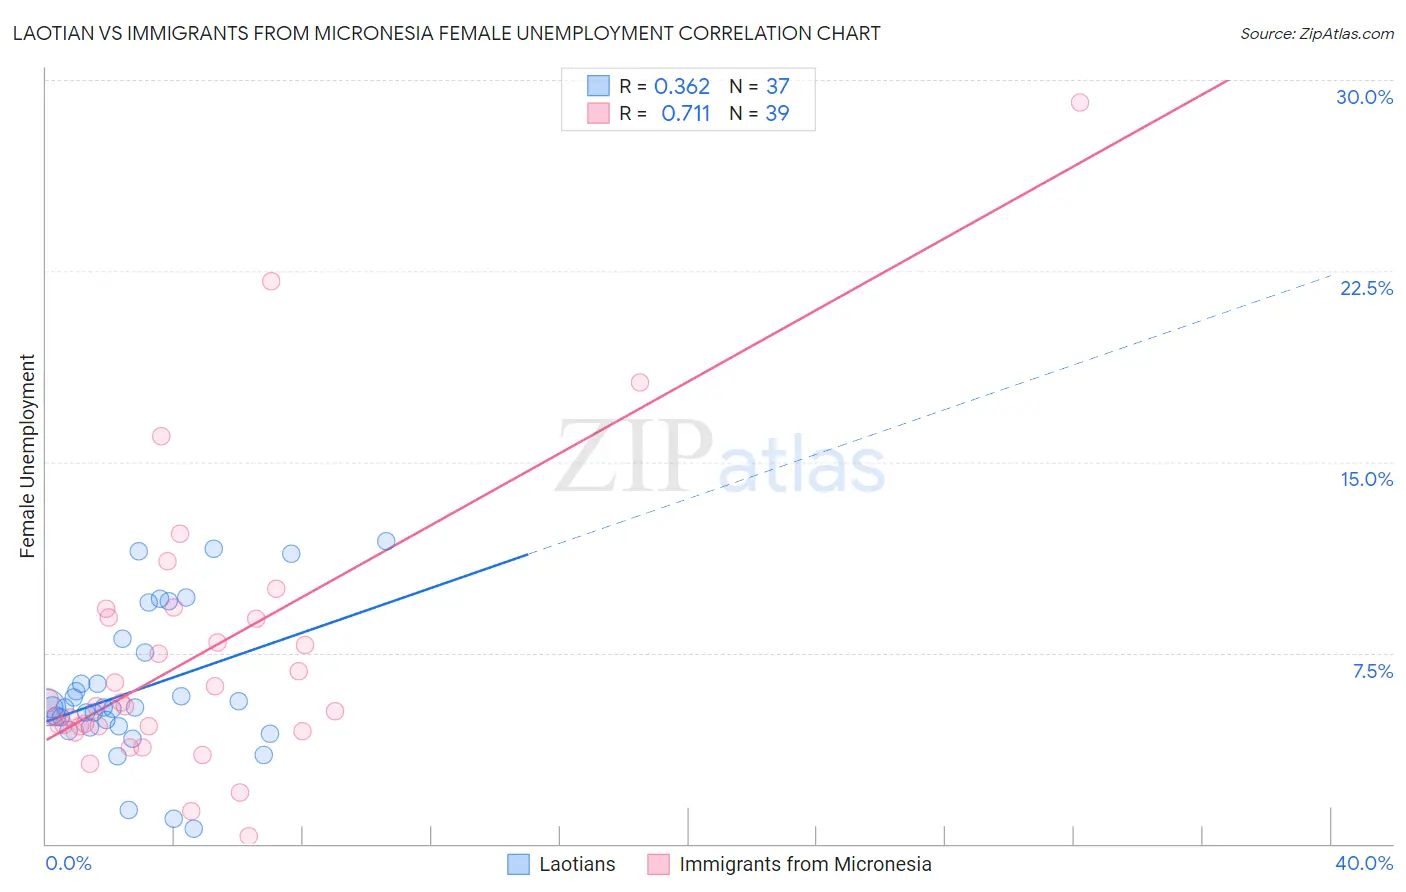
Laotian vs Immigrants from Micronesia Female Unemployment Correlation Chart
The statistical analysis conducted on geographies consisting of 224,555,281 people shows a mild positive correlation between the proportion of Laotians and unemploymnet rate among females in the United States with a correlation coefficient (R) of 0.362 and weighted average of 5.3%. Similarly, the statistical analysis conducted on geographies consisting of 61,521,067 people shows a strong positive correlation between the proportion of Immigrants from Micronesia and unemploymnet rate among females in the United States with a correlation coefficient (R) of 0.711 and weighted average of 5.2%, a difference of 1.4%.
Female Unemployment Correlation Summary
| Measurement | Laotian | Immigrants from Micronesia |
| Minimum | 0.60% | 0.30% |
| Maximum | 11.9% | 29.1% |
| Range | 11.3% | 28.8% |
| Mean | 6.1% | 7.4% |
| Median | 5.4% | 5.4% |
| Interquartile 25% (IQ1) | 4.6% | 4.6% |
| Interquartile 75% (IQ3) | 7.8% | 8.9% |
| Interquartile Range (IQR) | 3.2% | 4.3% |
| Standard Deviation (Sample) | 2.9% | 5.6% |
| Standard Deviation (Population) | 2.8% | 5.6% |
Demographics Similar to Laotians and Immigrants from Micronesia by Female Unemployment
In terms of female unemployment, the demographic groups most similar to Laotians are Immigrants from Southern Europe (5.3%, a difference of 0.070%), Immigrants from Vietnam (5.3%, a difference of 0.14%), Immigrants from Morocco (5.3%, a difference of 0.14%), Immigrants from Laos (5.3%, a difference of 0.15%), and Immigrants from Poland (5.3%, a difference of 0.30%). Similarly, the demographic groups most similar to Immigrants from Micronesia are Immigrants from Spain (5.2%, a difference of 0.010%), Immigrants from Pakistan (5.2%, a difference of 0.010%), Potawatomi (5.2%, a difference of 0.070%), Immigrants from Asia (5.2%, a difference of 0.18%), and Bangladeshi (5.2%, a difference of 0.18%).
| Demographics | Rating | Rank | Female Unemployment |
| Immigrants | Micronesia | 66.9 /100 | #159 | Good 5.2% |
| Immigrants | Spain | 66.8 /100 | #160 | Good 5.2% |
| Immigrants | Pakistan | 66.7 /100 | #161 | Good 5.2% |
| Potawatomi | 65.9 /100 | #162 | Good 5.2% |
| Immigrants | Asia | 64.3 /100 | #163 | Good 5.2% |
| Bangladeshis | 64.3 /100 | #164 | Good 5.2% |
| Syrians | 62.8 /100 | #165 | Good 5.2% |
| Native Hawaiians | 62.7 /100 | #166 | Good 5.2% |
| Immigrants | Thailand | 62.1 /100 | #167 | Good 5.2% |
| Sri Lankans | 59.4 /100 | #168 | Average 5.2% |
| Immigrants | Chile | 59.0 /100 | #169 | Average 5.2% |
| Spanish | 55.9 /100 | #170 | Average 5.2% |
| Immigrants | Denmark | 55.0 /100 | #171 | Average 5.2% |
| Immigrants | Uganda | 50.7 /100 | #172 | Average 5.3% |
| Iranians | 50.4 /100 | #173 | Average 5.3% |
| Immigrants | Poland | 50.0 /100 | #174 | Average 5.3% |
| Immigrants | Laos | 47.5 /100 | #175 | Average 5.3% |
| Immigrants | Vietnam | 47.5 /100 | #176 | Average 5.3% |
| Immigrants | Morocco | 47.4 /100 | #177 | Average 5.3% |
| Immigrants | Southern Europe | 46.2 /100 | #178 | Average 5.3% |
| Laotians | 45.1 /100 | #179 | Average 5.3% |