Laotian vs French American Indian Female Unemployment

COMPARE

Laotian
Race
Ancestry
AfghanAfricanAlaska NativeAlaskan AthabascanAlbanianAleutAlsatianAmericanApacheArabArapahoArgentineanArmenianAssyrian/Chaldean/SyriacAustralianAustrianBahamianBangladeshiBarbadianBasqueBelgianBelizeanBermudanBhutaneseBlackfeetBolivianBrazilianBritishBritish West IndianBulgarianBurmeseCajunCambodianCanadianCape VerdeanCarpatho RusynCelticCentral AmericanCentral American IndianCherokeeCheyenneChickasawChileanChineseChippewaChoctawColombianColvilleComancheCosta RicanCreeCreekCroatianCrowCubanCypriotCzechCzechoslovakianDanishDelawareDominicanDutchDutch West IndianEastern EuropeanEcuadorianEgyptianEnglishEstonianEthiopianEuropeanFijianFilipinoFinnishFrenchFrench CanadianGermanGerman RussianGhanaianGreekGuamanian/ChamorroGuatemalanGuyaneseHaitianHmongHonduranHopiHoumaHungarianIcelanderIndian (Asian)IndonesianInupiatIranianIraqiIrishIroquoisIsraeliItalianJamaicanJapaneseJordanianKenyanKiowaKoreanLaotianLatvianLebaneseLiberianLithuanianLumbeeLuxembourgerMacedonianMalaysianMalteseMarshalleseMenomineeMexicanMexican American IndianMongolianMoroccanNative HawaiianNavajoNepaleseNew ZealanderNicaraguanNigerianNorthern EuropeanNorwegianOkinawanOsageOttawaPaiutePakistaniPalestinianPanamanianParaguayanPennsylvania GermanPeruvianPimaPolishPortuguesePotawatomiPuebloPuerto RicanPuget Sound SalishRomanianRussianSalvadoranSamoanScandinavianScotch-IrishScottishSeminoleSenegaleseSerbianShoshoneSierra LeoneanSiouxSlavicSlovakSloveneSomaliSouth AfricanSouth AmericanSouth American IndianSoviet UnionSpaniardSpanishSpanish AmericanSpanish American IndianSri LankanSubsaharan AfricanSudaneseSwedishSwissSyrianTaiwaneseThaiTlingit-HaidaTohono O'OdhamTonganTrinidadian and TobagonianTsimshianTurkishU.S. Virgin IslanderUgandanUkrainianUruguayanUteVenezuelanVietnameseWelshWest IndianYakamaYaquiYugoslavianYumanYup'ikZimbabwean
Immigration
NonimmigrantsImmigrantsAfghanistanAfricaAlbaniaArgentinaArmeniaAsiaAustraliaAustriaBahamasBangladeshBarbadosBelarusBelgiumBelizeBoliviaBosnia and HerzegovinaBrazilBulgariaBurma/MyanmarCabo VerdeCambodiaCameroonCanadaCaribbeanCentral AmericaChileChinaColombiaCongoCosta RicaCroatiaCubaCzechoslovakiaDenmarkDominicaDominican RepublicEastern AfricaEastern AsiaEastern EuropeEcuadorEgyptEl SalvadorEnglandEritreaEthiopiaEuropeFijiFranceGermanyGhanaGreeceGrenadaGuatemalaGuyanaHaitiHondurasHong KongHungaryIndiaIndonesiaIranIraqIrelandIsraelItalyJamaicaJapanJordanKazakhstanKenyaKoreaKuwaitLaosLatin AmericaLatviaLebanonLiberiaLithuaniaMalaysiaMexicoMicronesiaMiddle AfricaMoldovaMoroccoNepalNetherlandsNicaraguaNigeriaNorth AmericaNorth MacedoniaNorthern AfricaNorthern EuropeNorwayOceaniaPakistanPanamaPeruPhilippinesPolandPortugalRomaniaRussiaSaudi ArabiaScotlandSenegalSerbiaSierra LeoneSingaporeSomaliaSouth AfricaSouth AmericaSouth Central AsiaSouth Eastern AsiaSouthern EuropeSpainSri LankaSt. Vincent and the GrenadinesSudanSwedenSwitzerlandSyriaTaiwanThailandTrinidad and TobagoTurkeyUgandaUkraineUruguayUzbekistanVenezuelaVietnamWest IndiesWestern AfricaWestern AsiaWestern EuropeYemenZaireZimbabweAzores
French American Indian
Race
Ancestry
AfghanAfricanAlaska NativeAlaskan AthabascanAlbanianAleutAlsatianAmericanApacheArabArapahoArgentineanArmenianAssyrian/Chaldean/SyriacAustralianAustrianBahamianBangladeshiBarbadianBasqueBelgianBelizeanBermudanBhutaneseBlackfeetBolivianBrazilianBritishBritish West IndianBulgarianBurmeseCajunCambodianCanadianCape VerdeanCarpatho RusynCelticCentral AmericanCentral American IndianCherokeeCheyenneChickasawChileanChineseChippewaChoctawColombianColvilleComancheCosta RicanCreeCreekCroatianCrowCubanCypriotCzechCzechoslovakianDanishDelawareDominicanDutchDutch West IndianEastern EuropeanEcuadorianEgyptianEnglishEstonianEthiopianEuropeanFijianFilipinoFinnishFrenchFrench American IndianFrench CanadianGermanGerman RussianGhanaianGreekGuamanian/ChamorroGuatemalanGuyaneseHaitianHmongHonduranHopiHoumaHungarianIcelanderIndian (Asian)IndonesianInupiatIranianIraqiIrishIroquoisIsraeliItalianJamaicanJapaneseJordanianKenyanKiowaKoreanLatvianLebaneseLiberianLithuanianLumbeeLuxembourgerMacedonianMalaysianMalteseMarshalleseMenomineeMexicanMexican American IndianMongolianMoroccanNative HawaiianNavajoNepaleseNew ZealanderNicaraguanNigerianNorthern EuropeanNorwegianOkinawanOsageOttawaPaiutePakistaniPalestinianPanamanianParaguayanPennsylvania GermanPeruvianPimaPolishPortuguesePotawatomiPuebloPuerto RicanPuget Sound SalishRomanianRussianSalvadoranSamoanScandinavianScotch-IrishScottishSeminoleSenegaleseSerbianShoshoneSierra LeoneanSiouxSlavicSlovakSloveneSomaliSouth AfricanSouth AmericanSouth American IndianSoviet UnionSpaniardSpanishSpanish AmericanSpanish American IndianSri LankanSubsaharan AfricanSudaneseSwedishSwissSyrianTaiwaneseThaiTlingit-HaidaTohono O'OdhamTonganTrinidadian and TobagonianTsimshianTurkishU.S. Virgin IslanderUgandanUkrainianUruguayanUteVenezuelanVietnameseWelshWest IndianYakamaYaquiYugoslavianYumanYup'ikZimbabwean
Immigration
NonimmigrantsImmigrantsAfghanistanAfricaAlbaniaArgentinaArmeniaAsiaAustraliaAustriaBahamasBangladeshBarbadosBelarusBelgiumBelizeBoliviaBosnia and HerzegovinaBrazilBulgariaBurma/MyanmarCabo VerdeCambodiaCameroonCanadaCaribbeanCentral AmericaChileChinaColombiaCongoCosta RicaCroatiaCubaCzechoslovakiaDenmarkDominicaDominican RepublicEastern AfricaEastern AsiaEastern EuropeEcuadorEgyptEl SalvadorEnglandEritreaEthiopiaEuropeFijiFranceGermanyGhanaGreeceGrenadaGuatemalaGuyanaHaitiHondurasHong KongHungaryIndiaIndonesiaIranIraqIrelandIsraelItalyJamaicaJapanJordanKazakhstanKenyaKoreaKuwaitLaosLatin AmericaLatviaLebanonLiberiaLithuaniaMalaysiaMexicoMicronesiaMiddle AfricaMoldovaMoroccoNepalNetherlandsNicaraguaNigeriaNorth AmericaNorth MacedoniaNorthern AfricaNorthern EuropeNorwayOceaniaPakistanPanamaPeruPhilippinesPolandPortugalRomaniaRussiaSaudi ArabiaScotlandSenegalSerbiaSierra LeoneSingaporeSomaliaSouth AfricaSouth AmericaSouth Central AsiaSouth Eastern AsiaSouthern EuropeSpainSri LankaSt. Vincent and the GrenadinesSudanSwedenSwitzerlandSyriaTaiwanThailandTrinidad and TobagoTurkeyUgandaUkraineUruguayUzbekistanVenezuelaVietnamWest IndiesWestern AfricaWestern AsiaWestern EuropeYemenZaireZimbabweAzores
Female Unemployment
Income
Poverty
Unemployment
Labor Participation
Family Structure
Vehicle Availability
Education Level
Disability

Female Unemployment Comparison

Laotians

French American Indians

Average
Tragic
5.3%
FEMALE UNEMPLOYMENT
45.1/ 100
METRIC RATING
179th/ 347
METRIC RANK
5.5%
FEMALE UNEMPLOYMENT
6.1/ 100
METRIC RATING
225th/ 347
METRIC RANK

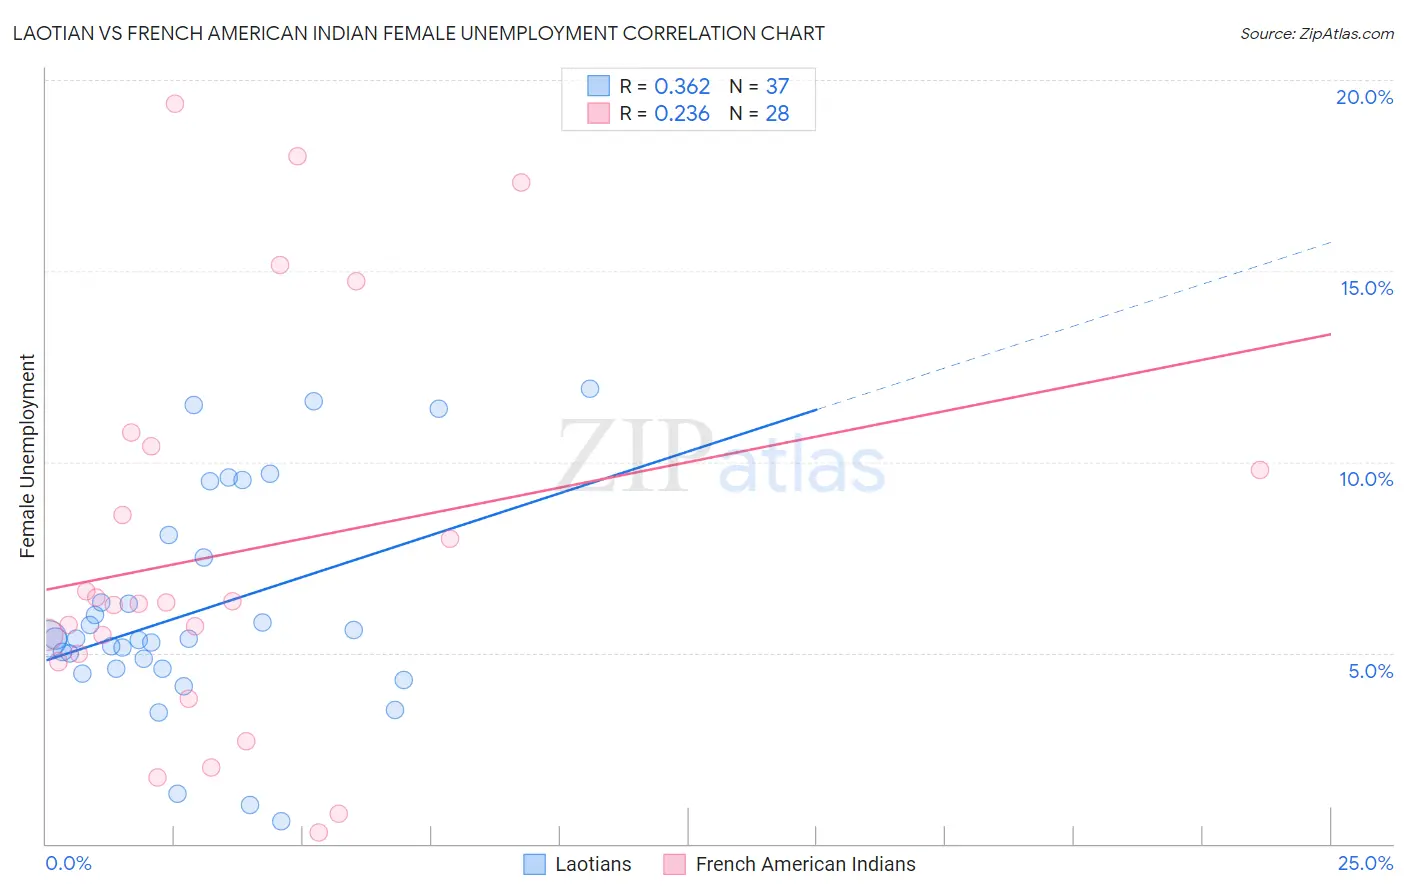
Laotian vs French American Indian Female Unemployment Correlation Chart

The statistical analysis conducted on geographies consisting of 224,555,281 people shows a mild positive correlation between the proportion of Laotians and unemploymnet rate among females in the United States with a correlation coefficient (R) of 0.362 and weighted average of 5.3%. Similarly, the statistical analysis conducted on geographies consisting of 131,515,161 people shows a weak positive correlation between the proportion of French American Indians and unemploymnet rate among females in the United States with a correlation coefficient (R) of 0.236 and weighted average of 5.5%, a difference of 3.8%.
Laotian vs French American Indian Female Unemployment

Female Unemployment Correlation Summary

MeasurementLaotianFrench American Indian
Minimum0.60%0.30%
Maximum11.9%19.4%
Range11.3%19.1%
Mean6.1%7.6%
Median5.4%6.3%
Interquartile 25% (IQ1)4.6%4.9%
Interquartile 75% (IQ3)7.8%10.1%
Interquartile Range (IQR)3.2%5.2%
Standard Deviation (Sample)2.9%5.2%
Standard Deviation (Population)2.8%5.1%

Similar Demographics by Female Unemployment

Demographics Similar to Laotians by Female Unemployment

In terms of female unemployment, the demographic groups most similar to Laotians are Immigrants from Southern Europe (5.3%, a difference of 0.070%), Immigrants from Congo (5.3%, a difference of 0.12%), Immigrants from Vietnam (5.3%, a difference of 0.14%), Immigrants from Morocco (5.3%, a difference of 0.14%), and Taiwanese (5.3%, a difference of 0.14%).
DemographicsRating | RankFemale Unemployment
Immigrants | Uganda
50.7
/100
|
#172
Average
5.3%
Iranians
50.4
/100
|
#173
Average
5.3%
Immigrants | Poland
50.0
/100
|
#174
Average
5.3%
Immigrants | Laos
47.5
/100
|
#175
Average
5.3%
Immigrants | Vietnam
47.5
/100
|
#176
Average
5.3%
Immigrants | Morocco
47.4
/100
|
#177
Average
5.3%
Immigrants | Southern Europe
46.2
/100
|
#178
Average
5.3%
Laotians
45.1
/100
|
#179
Average
5.3%
Immigrants | Congo
43.1
/100
|
#180
Average
5.3%
Taiwanese
42.7
/100
|
#181
Average
5.3%
Immigrants | Nonimmigrants
42.6
/100
|
#182
Average
5.3%
Immigrants | Indonesia
40.7
/100
|
#183
Average
5.3%
Immigrants | Ukraine
40.1
/100
|
#184
Average
5.3%
Malaysians
40.1
/100
|
#185
Average
5.3%
Immigrants | Belarus
39.4
/100
|
#186
Fair
5.3%

Demographics Similar to French American Indians by Female Unemployment

In terms of female unemployment, the demographic groups most similar to French American Indians are Immigrants from Peru (5.5%, a difference of 0.040%), Immigrants from Philippines (5.5%, a difference of 0.21%), Iraqi (5.5%, a difference of 0.22%), Delaware (5.5%, a difference of 0.25%), and Nicaraguan (5.5%, a difference of 0.27%).
DemographicsRating | RankFemale Unemployment
Bermudans
9.0
/100
|
#218
Tragic
5.4%
South Americans
8.6
/100
|
#219
Tragic
5.4%
Immigrants | Africa
8.5
/100
|
#220
Tragic
5.4%
Brazilians
7.3
/100
|
#221
Tragic
5.5%
Nicaraguans
7.2
/100
|
#222
Tragic
5.5%
Delaware
7.2
/100
|
#223
Tragic
5.5%
Iraqis
7.1
/100
|
#224
Tragic
5.5%
French American Indians
6.1
/100
|
#225
Tragic
5.5%
Immigrants | Peru
5.9
/100
|
#226
Tragic
5.5%
Immigrants | Philippines
5.3
/100
|
#227
Tragic
5.5%
Israelis
4.8
/100
|
#228
Tragic
5.5%
Panamanians
4.7
/100
|
#229
Tragic
5.5%
Immigrants | Uruguay
4.7
/100
|
#230
Tragic
5.5%
Immigrants | Iraq
3.9
/100
|
#231
Tragic
5.5%
Liberians
3.9
/100
|
#232
Tragic
5.5%