Immigrants from Barbados vs Immigrants from Pakistan Unemployment
COMPARE
Immigrants from Barbados
Immigrants from Pakistan
Unemployment
Unemployment Comparison
Immigrants from Barbados
Immigrants from Pakistan
6.6%
UNEMPLOYMENT
0.0/ 100
METRIC RATING
313th/ 347
METRIC RANK
5.1%
UNEMPLOYMENT
83.2/ 100
METRIC RATING
142nd/ 347
METRIC RANK
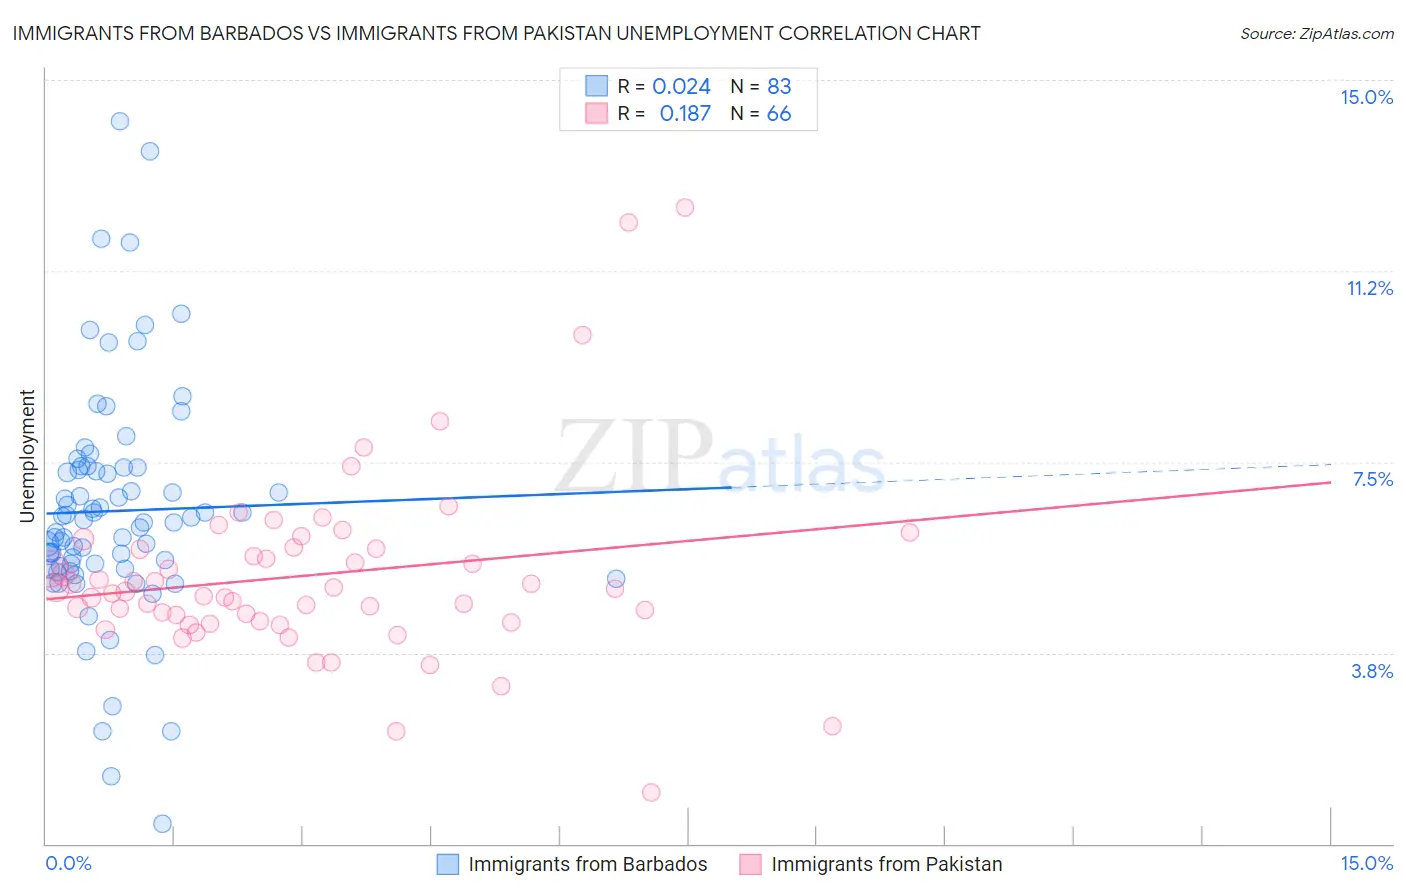
Immigrants from Barbados vs Immigrants from Pakistan Unemployment Correlation Chart
The statistical analysis conducted on geographies consisting of 112,764,832 people shows no correlation between the proportion of Immigrants from Barbados and unemployment in the United States with a correlation coefficient (R) of 0.024 and weighted average of 6.6%. Similarly, the statistical analysis conducted on geographies consisting of 283,838,278 people shows a poor positive correlation between the proportion of Immigrants from Pakistan and unemployment in the United States with a correlation coefficient (R) of 0.187 and weighted average of 5.1%, a difference of 28.6%.
Unemployment Correlation Summary
| Measurement | Immigrants from Barbados | Immigrants from Pakistan |
| Minimum | 0.40% | 1.0% |
| Maximum | 14.2% | 12.5% |
| Range | 13.8% | 11.5% |
| Mean | 6.5% | 5.3% |
| Median | 6.3% | 5.0% |
| Interquartile 25% (IQ1) | 5.4% | 4.4% |
| Interquartile 75% (IQ3) | 7.4% | 5.8% |
| Interquartile Range (IQR) | 2.0% | 1.4% |
| Standard Deviation (Sample) | 2.3% | 1.8% |
| Standard Deviation (Population) | 2.3% | 1.8% |
Similar Demographics by Unemployment
Demographics Similar to Immigrants from Barbados by Unemployment
In terms of unemployment, the demographic groups most similar to Immigrants from Barbados are Colville (6.6%, a difference of 0.38%), Black/African American (6.6%, a difference of 0.55%), Cape Verdean (6.5%, a difference of 0.95%), Immigrants from Belize (6.5%, a difference of 1.3%), and Houma (6.7%, a difference of 1.3%).
| Demographics | Rating | Rank | Unemployment |
| Lumbee | 0.0 /100 | #306 | Tragic 6.4% |
| Immigrants | Bangladesh | 0.0 /100 | #307 | Tragic 6.5% |
| Barbadians | 0.0 /100 | #308 | Tragic 6.5% |
| Vietnamese | 0.0 /100 | #309 | Tragic 6.5% |
| Immigrants | Belize | 0.0 /100 | #310 | Tragic 6.5% |
| Cape Verdeans | 0.0 /100 | #311 | Tragic 6.5% |
| Colville | 0.0 /100 | #312 | Tragic 6.6% |
| Immigrants | Barbados | 0.0 /100 | #313 | Tragic 6.6% |
| Blacks/African Americans | 0.0 /100 | #314 | Tragic 6.6% |
| Houma | 0.0 /100 | #315 | Tragic 6.7% |
| Immigrants | Dominica | 0.0 /100 | #316 | Tragic 6.7% |
| Shoshone | 0.0 /100 | #317 | Tragic 6.8% |
| Immigrants | Cabo Verde | 0.0 /100 | #318 | Tragic 6.8% |
| British West Indians | 0.0 /100 | #319 | Tragic 6.8% |
| Immigrants | St. Vincent and the Grenadines | 0.0 /100 | #320 | Tragic 6.9% |
Demographics Similar to Immigrants from Pakistan by Unemployment
In terms of unemployment, the demographic groups most similar to Immigrants from Pakistan are Palestinian (5.1%, a difference of 0.020%), Immigrants from Chile (5.1%, a difference of 0.050%), Indonesian (5.1%, a difference of 0.10%), Immigrants from Denmark (5.1%, a difference of 0.12%), and Immigrants from Norway (5.1%, a difference of 0.15%).
| Demographics | Rating | Rank | Unemployment |
| Immigrants | Burma/Myanmar | 86.2 /100 | #135 | Excellent 5.1% |
| Immigrants | Spain | 86.2 /100 | #136 | Excellent 5.1% |
| Immigrants | Saudi Arabia | 85.6 /100 | #137 | Excellent 5.1% |
| Immigrants | Hungary | 85.6 /100 | #138 | Excellent 5.1% |
| Pakistanis | 85.3 /100 | #139 | Excellent 5.1% |
| Immigrants | Denmark | 84.3 /100 | #140 | Excellent 5.1% |
| Palestinians | 83.4 /100 | #141 | Excellent 5.1% |
| Immigrants | Pakistan | 83.2 /100 | #142 | Excellent 5.1% |
| Immigrants | Chile | 82.8 /100 | #143 | Excellent 5.1% |
| Indonesians | 82.3 /100 | #144 | Excellent 5.1% |
| Immigrants | Norway | 81.8 /100 | #145 | Excellent 5.1% |
| Immigrants | Asia | 81.8 /100 | #146 | Excellent 5.1% |
| Indians (Asian) | 81.6 /100 | #147 | Excellent 5.1% |
| Immigrants | Italy | 79.1 /100 | #148 | Good 5.1% |
| Syrians | 77.7 /100 | #149 | Good 5.2% |