Immigrants from Barbados vs Chinese Unemployment
COMPARE
Immigrants from Barbados
Chinese
Unemployment
Unemployment Comparison
Immigrants from Barbados
Chinese
6.6%
UNEMPLOYMENT
0.0/ 100
METRIC RATING
313th/ 347
METRIC RANK
4.7%
UNEMPLOYMENT
99.9/ 100
METRIC RATING
16th/ 347
METRIC RANK
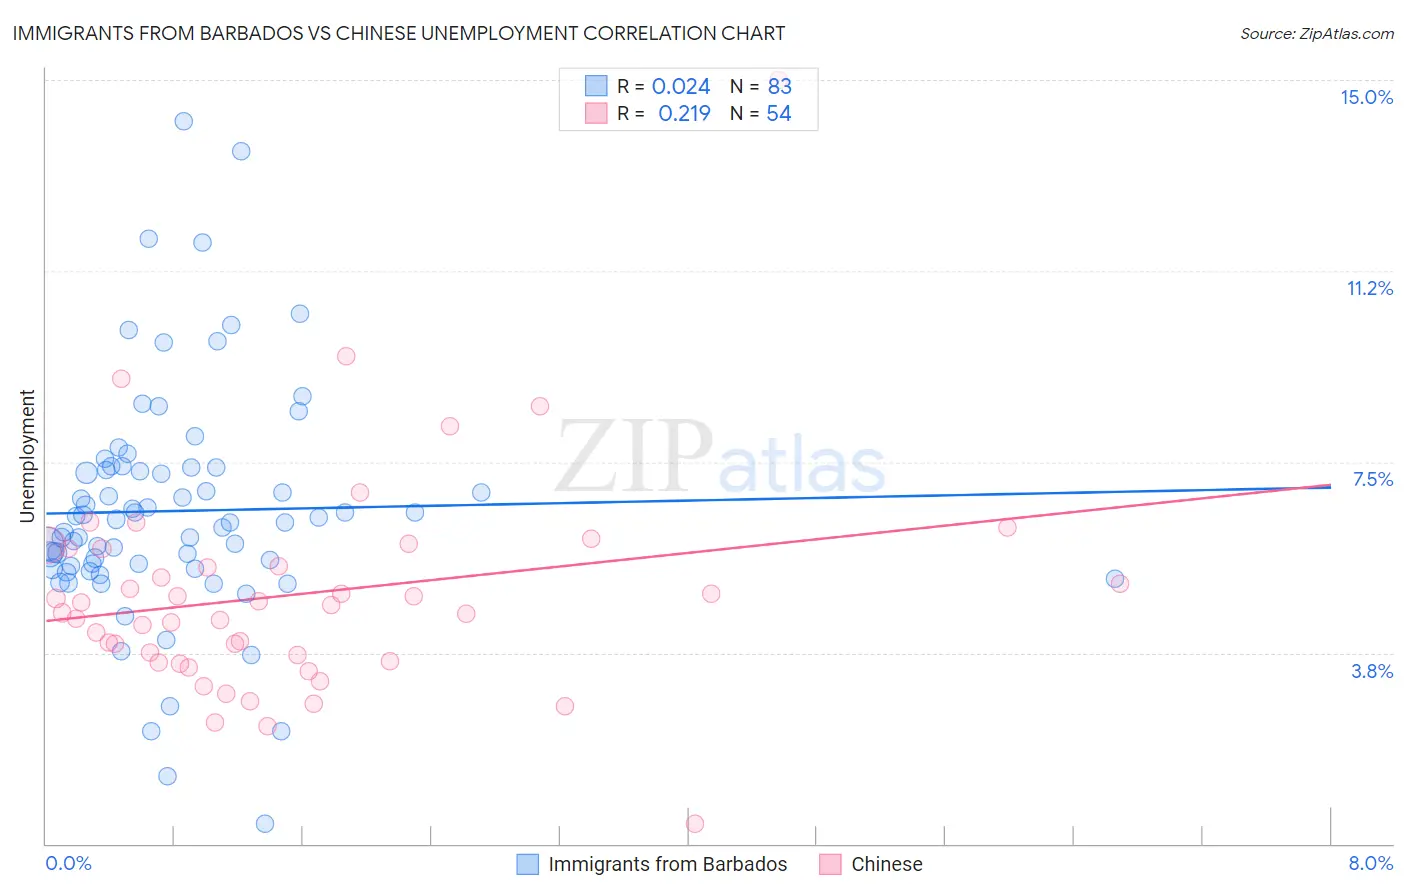
Immigrants from Barbados vs Chinese Unemployment Correlation Chart
The statistical analysis conducted on geographies consisting of 112,764,832 people shows no correlation between the proportion of Immigrants from Barbados and unemployment in the United States with a correlation coefficient (R) of 0.024 and weighted average of 6.6%. Similarly, the statistical analysis conducted on geographies consisting of 64,790,103 people shows a weak positive correlation between the proportion of Chinese and unemployment in the United States with a correlation coefficient (R) of 0.219 and weighted average of 4.7%, a difference of 41.8%.
Unemployment Correlation Summary
| Measurement | Immigrants from Barbados | Chinese |
| Minimum | 0.40% | 0.40% |
| Maximum | 14.2% | 15.0% |
| Range | 13.8% | 14.6% |
| Mean | 6.5% | 4.9% |
| Median | 6.3% | 4.6% |
| Interquartile 25% (IQ1) | 5.4% | 3.6% |
| Interquartile 75% (IQ3) | 7.4% | 5.8% |
| Interquartile Range (IQR) | 2.0% | 2.2% |
| Standard Deviation (Sample) | 2.3% | 2.2% |
| Standard Deviation (Population) | 2.3% | 2.2% |
Similar Demographics by Unemployment
Demographics Similar to Immigrants from Barbados by Unemployment
In terms of unemployment, the demographic groups most similar to Immigrants from Barbados are Colville (6.6%, a difference of 0.38%), Black/African American (6.6%, a difference of 0.55%), Cape Verdean (6.5%, a difference of 0.95%), Immigrants from Belize (6.5%, a difference of 1.3%), and Houma (6.7%, a difference of 1.3%).
| Demographics | Rating | Rank | Unemployment |
| Lumbee | 0.0 /100 | #306 | Tragic 6.4% |
| Immigrants | Bangladesh | 0.0 /100 | #307 | Tragic 6.5% |
| Barbadians | 0.0 /100 | #308 | Tragic 6.5% |
| Vietnamese | 0.0 /100 | #309 | Tragic 6.5% |
| Immigrants | Belize | 0.0 /100 | #310 | Tragic 6.5% |
| Cape Verdeans | 0.0 /100 | #311 | Tragic 6.5% |
| Colville | 0.0 /100 | #312 | Tragic 6.6% |
| Immigrants | Barbados | 0.0 /100 | #313 | Tragic 6.6% |
| Blacks/African Americans | 0.0 /100 | #314 | Tragic 6.6% |
| Houma | 0.0 /100 | #315 | Tragic 6.7% |
| Immigrants | Dominica | 0.0 /100 | #316 | Tragic 6.7% |
| Shoshone | 0.0 /100 | #317 | Tragic 6.8% |
| Immigrants | Cabo Verde | 0.0 /100 | #318 | Tragic 6.8% |
| British West Indians | 0.0 /100 | #319 | Tragic 6.8% |
| Immigrants | St. Vincent and the Grenadines | 0.0 /100 | #320 | Tragic 6.9% |
Demographics Similar to Chinese by Unemployment
In terms of unemployment, the demographic groups most similar to Chinese are Slovene (4.7%, a difference of 0.10%), Immigrants from Venezuela (4.7%, a difference of 0.13%), European (4.6%, a difference of 0.14%), Scottish (4.7%, a difference of 0.21%), and Immigrants from Cuba (4.6%, a difference of 0.62%).
| Demographics | Rating | Rank | Unemployment |
| Scandinavians | 100.0 /100 | #9 | Exceptional 4.5% |
| Dutch | 100.0 /100 | #10 | Exceptional 4.6% |
| English | 100.0 /100 | #11 | Exceptional 4.6% |
| Pennsylvania Germans | 100.0 /100 | #12 | Exceptional 4.6% |
| Belgians | 100.0 /100 | #13 | Exceptional 4.6% |
| Immigrants | Cuba | 100.0 /100 | #14 | Exceptional 4.6% |
| Europeans | 99.9 /100 | #15 | Exceptional 4.6% |
| Chinese | 99.9 /100 | #16 | Exceptional 4.7% |
| Slovenes | 99.9 /100 | #17 | Exceptional 4.7% |
| Immigrants | Venezuela | 99.9 /100 | #18 | Exceptional 4.7% |
| Scottish | 99.9 /100 | #19 | Exceptional 4.7% |
| Carpatho Rusyns | 99.9 /100 | #20 | Exceptional 4.7% |
| Welsh | 99.9 /100 | #21 | Exceptional 4.7% |
| Thais | 99.9 /100 | #22 | Exceptional 4.7% |
| British | 99.9 /100 | #23 | Exceptional 4.7% |