Immigrants from Lithuania vs Immigrants from Pakistan Unemployment
COMPARE
Immigrants from Lithuania
Immigrants from Pakistan
Unemployment
Unemployment Comparison
Immigrants from Lithuania
Immigrants from Pakistan
5.0%
UNEMPLOYMENT
93.2/ 100
METRIC RATING
110th/ 347
METRIC RANK
5.1%
UNEMPLOYMENT
83.2/ 100
METRIC RATING
142nd/ 347
METRIC RANK
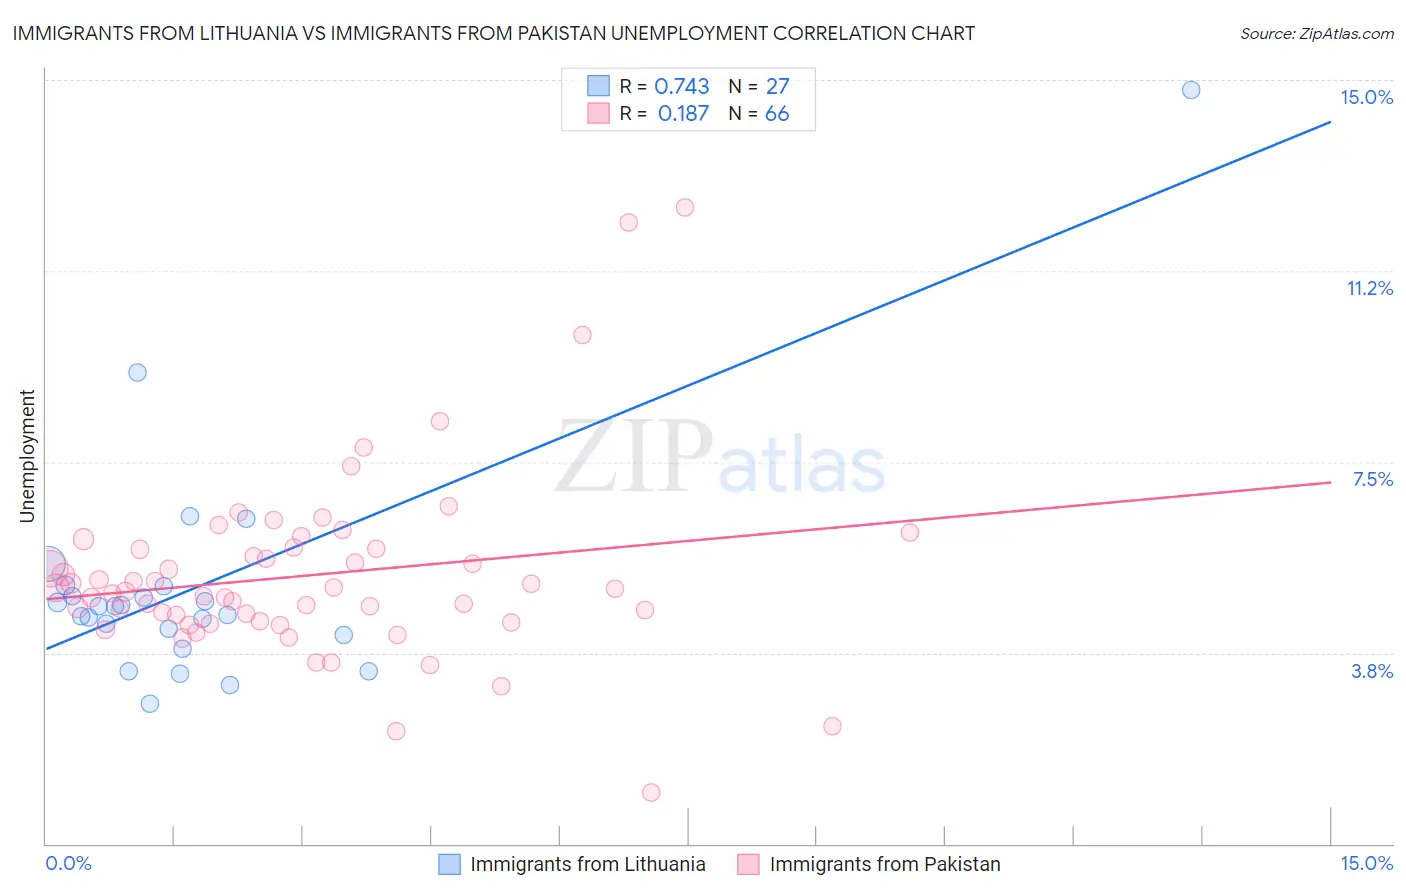
Immigrants from Lithuania vs Immigrants from Pakistan Unemployment Correlation Chart
The statistical analysis conducted on geographies consisting of 117,711,175 people shows a strong positive correlation between the proportion of Immigrants from Lithuania and unemployment in the United States with a correlation coefficient (R) of 0.743 and weighted average of 5.0%. Similarly, the statistical analysis conducted on geographies consisting of 283,838,278 people shows a poor positive correlation between the proportion of Immigrants from Pakistan and unemployment in the United States with a correlation coefficient (R) of 0.187 and weighted average of 5.1%, a difference of 1.6%.
Unemployment Correlation Summary
| Measurement | Immigrants from Lithuania | Immigrants from Pakistan |
| Minimum | 2.7% | 1.0% |
| Maximum | 14.8% | 12.5% |
| Range | 12.1% | 11.5% |
| Mean | 5.0% | 5.3% |
| Median | 4.7% | 5.0% |
| Interquartile 25% (IQ1) | 4.1% | 4.4% |
| Interquartile 75% (IQ3) | 5.1% | 5.8% |
| Interquartile Range (IQR) | 0.96% | 1.4% |
| Standard Deviation (Sample) | 2.3% | 1.8% |
| Standard Deviation (Population) | 2.3% | 1.8% |
Similar Demographics by Unemployment
Demographics Similar to Immigrants from Lithuania by Unemployment
In terms of unemployment, the demographic groups most similar to Immigrants from Lithuania are Chilean (5.0%, a difference of 0.0%), Immigrants from Eritrea (5.0%, a difference of 0.020%), Immigrants from Kuwait (5.0%, a difference of 0.12%), Immigrants from Turkey (5.0%, a difference of 0.13%), and Immigrants from Romania (5.0%, a difference of 0.14%).
| Demographics | Rating | Rank | Unemployment |
| Chickasaw | 94.0 /100 | #103 | Exceptional 5.0% |
| Osage | 94.0 /100 | #104 | Exceptional 5.0% |
| Maltese | 94.0 /100 | #105 | Exceptional 5.0% |
| Immigrants | Romania | 93.7 /100 | #106 | Exceptional 5.0% |
| Immigrants | Turkey | 93.7 /100 | #107 | Exceptional 5.0% |
| Immigrants | Kuwait | 93.7 /100 | #108 | Exceptional 5.0% |
| Immigrants | Eritrea | 93.3 /100 | #109 | Exceptional 5.0% |
| Immigrants | Lithuania | 93.2 /100 | #110 | Exceptional 5.0% |
| Chileans | 93.2 /100 | #111 | Exceptional 5.0% |
| South Africans | 92.6 /100 | #112 | Exceptional 5.1% |
| Argentineans | 92.4 /100 | #113 | Exceptional 5.1% |
| Immigrants | Ireland | 92.1 /100 | #114 | Exceptional 5.1% |
| Immigrants | Western Europe | 91.1 /100 | #115 | Exceptional 5.1% |
| Immigrants | Sri Lanka | 91.1 /100 | #116 | Exceptional 5.1% |
| Immigrants | Malaysia | 91.0 /100 | #117 | Exceptional 5.1% |
Demographics Similar to Immigrants from Pakistan by Unemployment
In terms of unemployment, the demographic groups most similar to Immigrants from Pakistan are Palestinian (5.1%, a difference of 0.020%), Immigrants from Chile (5.1%, a difference of 0.050%), Indonesian (5.1%, a difference of 0.10%), Immigrants from Denmark (5.1%, a difference of 0.12%), and Immigrants from Norway (5.1%, a difference of 0.15%).
| Demographics | Rating | Rank | Unemployment |
| Immigrants | Burma/Myanmar | 86.2 /100 | #135 | Excellent 5.1% |
| Immigrants | Spain | 86.2 /100 | #136 | Excellent 5.1% |
| Immigrants | Saudi Arabia | 85.6 /100 | #137 | Excellent 5.1% |
| Immigrants | Hungary | 85.6 /100 | #138 | Excellent 5.1% |
| Pakistanis | 85.3 /100 | #139 | Excellent 5.1% |
| Immigrants | Denmark | 84.3 /100 | #140 | Excellent 5.1% |
| Palestinians | 83.4 /100 | #141 | Excellent 5.1% |
| Immigrants | Pakistan | 83.2 /100 | #142 | Excellent 5.1% |
| Immigrants | Chile | 82.8 /100 | #143 | Excellent 5.1% |
| Indonesians | 82.3 /100 | #144 | Excellent 5.1% |
| Immigrants | Norway | 81.8 /100 | #145 | Excellent 5.1% |
| Immigrants | Asia | 81.8 /100 | #146 | Excellent 5.1% |
| Indians (Asian) | 81.6 /100 | #147 | Excellent 5.1% |
| Immigrants | Italy | 79.1 /100 | #148 | Good 5.1% |
| Syrians | 77.7 /100 | #149 | Good 5.2% |