Immigrants from Barbados vs Potawatomi Unemployment
COMPARE
Immigrants from Barbados
Potawatomi
Unemployment
Unemployment Comparison
Immigrants from Barbados
Potawatomi
6.6%
UNEMPLOYMENT
0.0/ 100
METRIC RATING
313th/ 347
METRIC RANK
5.2%
UNEMPLOYMENT
76.2/ 100
METRIC RATING
150th/ 347
METRIC RANK
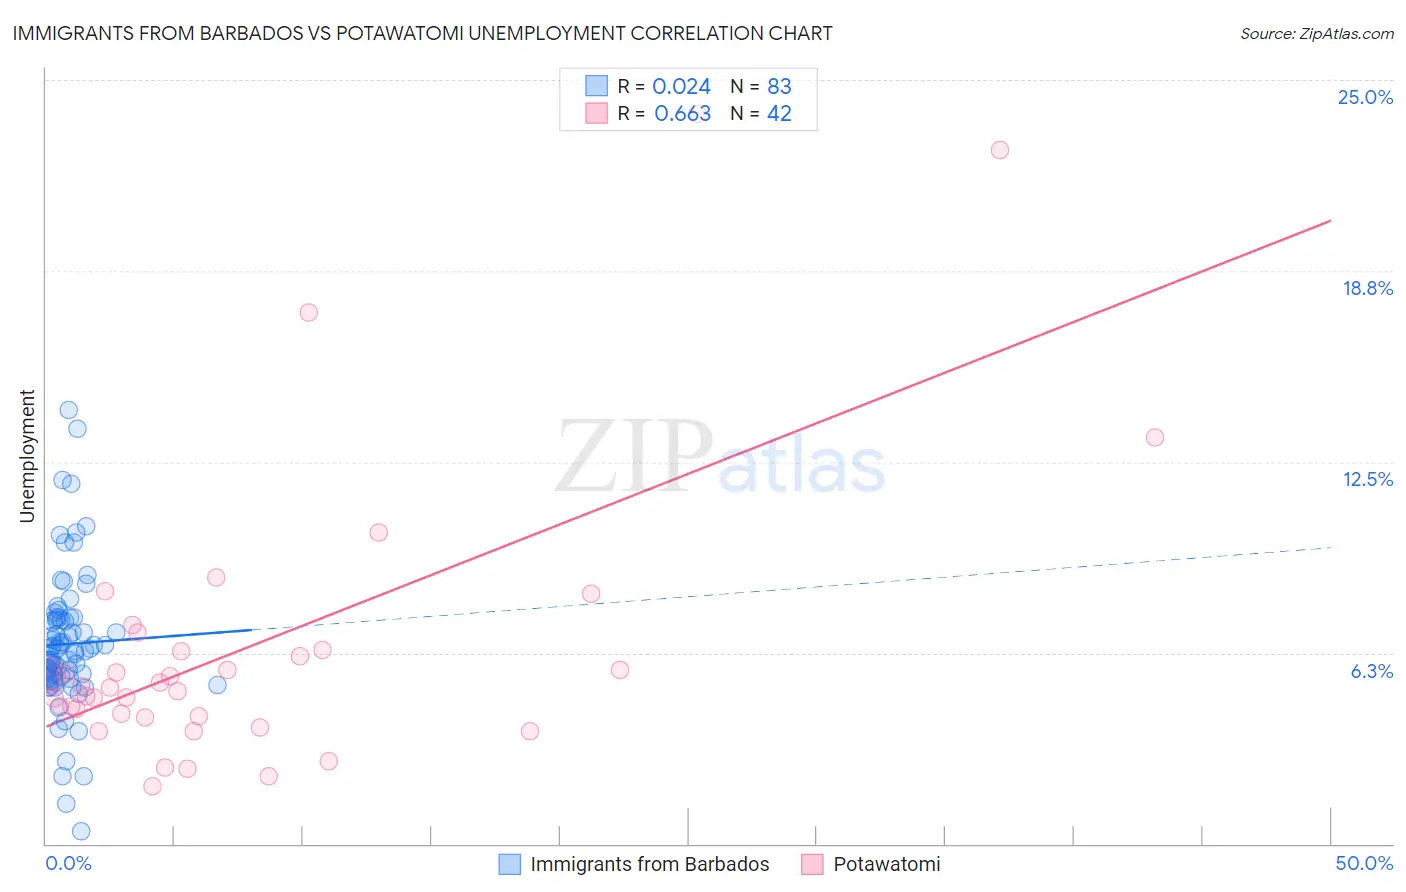
Immigrants from Barbados vs Potawatomi Unemployment Correlation Chart
The statistical analysis conducted on geographies consisting of 112,764,832 people shows no correlation between the proportion of Immigrants from Barbados and unemployment in the United States with a correlation coefficient (R) of 0.024 and weighted average of 6.6%. Similarly, the statistical analysis conducted on geographies consisting of 117,685,766 people shows a significant positive correlation between the proportion of Potawatomi and unemployment in the United States with a correlation coefficient (R) of 0.663 and weighted average of 5.2%, a difference of 27.7%.
Unemployment Correlation Summary
| Measurement | Immigrants from Barbados | Potawatomi |
| Minimum | 0.40% | 1.9% |
| Maximum | 14.2% | 23.9% |
| Range | 13.8% | 22.0% |
| Mean | 6.5% | 6.5% |
| Median | 6.3% | 5.2% |
| Interquartile 25% (IQ1) | 5.4% | 4.2% |
| Interquartile 75% (IQ3) | 7.4% | 6.4% |
| Interquartile Range (IQR) | 2.0% | 2.2% |
| Standard Deviation (Sample) | 2.3% | 4.8% |
| Standard Deviation (Population) | 2.3% | 4.7% |
Similar Demographics by Unemployment
Demographics Similar to Immigrants from Barbados by Unemployment
In terms of unemployment, the demographic groups most similar to Immigrants from Barbados are Colville (6.6%, a difference of 0.38%), Black/African American (6.6%, a difference of 0.55%), Cape Verdean (6.5%, a difference of 0.95%), Immigrants from Belize (6.5%, a difference of 1.3%), and Houma (6.7%, a difference of 1.3%).
| Demographics | Rating | Rank | Unemployment |
| Lumbee | 0.0 /100 | #306 | Tragic 6.4% |
| Immigrants | Bangladesh | 0.0 /100 | #307 | Tragic 6.5% |
| Barbadians | 0.0 /100 | #308 | Tragic 6.5% |
| Vietnamese | 0.0 /100 | #309 | Tragic 6.5% |
| Immigrants | Belize | 0.0 /100 | #310 | Tragic 6.5% |
| Cape Verdeans | 0.0 /100 | #311 | Tragic 6.5% |
| Colville | 0.0 /100 | #312 | Tragic 6.6% |
| Immigrants | Barbados | 0.0 /100 | #313 | Tragic 6.6% |
| Blacks/African Americans | 0.0 /100 | #314 | Tragic 6.6% |
| Houma | 0.0 /100 | #315 | Tragic 6.7% |
| Immigrants | Dominica | 0.0 /100 | #316 | Tragic 6.7% |
| Shoshone | 0.0 /100 | #317 | Tragic 6.8% |
| Immigrants | Cabo Verde | 0.0 /100 | #318 | Tragic 6.8% |
| British West Indians | 0.0 /100 | #319 | Tragic 6.8% |
| Immigrants | St. Vincent and the Grenadines | 0.0 /100 | #320 | Tragic 6.9% |
Demographics Similar to Potawatomi by Unemployment
In terms of unemployment, the demographic groups most similar to Potawatomi are Immigrants from Eastern Europe (5.2%, a difference of 0.070%), Immigrants from Hong Kong (5.2%, a difference of 0.080%), Egyptian (5.2%, a difference of 0.080%), Immigrants from China (5.2%, a difference of 0.12%), and Syrian (5.2%, a difference of 0.14%).
| Demographics | Rating | Rank | Unemployment |
| Immigrants | Chile | 82.8 /100 | #143 | Excellent 5.1% |
| Indonesians | 82.3 /100 | #144 | Excellent 5.1% |
| Immigrants | Norway | 81.8 /100 | #145 | Excellent 5.1% |
| Immigrants | Asia | 81.8 /100 | #146 | Excellent 5.1% |
| Indians (Asian) | 81.6 /100 | #147 | Excellent 5.1% |
| Immigrants | Italy | 79.1 /100 | #148 | Good 5.1% |
| Syrians | 77.7 /100 | #149 | Good 5.2% |
| Potawatomi | 76.2 /100 | #150 | Good 5.2% |
| Immigrants | Eastern Europe | 75.3 /100 | #151 | Good 5.2% |
| Immigrants | Hong Kong | 75.2 /100 | #152 | Good 5.2% |
| Egyptians | 75.2 /100 | #153 | Good 5.2% |
| Immigrants | China | 74.7 /100 | #154 | Good 5.2% |
| Immigrants | Northern Africa | 71.3 /100 | #155 | Good 5.2% |
| Immigrants | Kazakhstan | 70.4 /100 | #156 | Good 5.2% |
| Sri Lankans | 69.5 /100 | #157 | Good 5.2% |