Immigrants from Barbados vs Immigrants from Pakistan Nursery School
COMPARE
Immigrants from Barbados
Immigrants from Pakistan
Nursery School
Nursery School Comparison
Immigrants from Barbados
Immigrants from Pakistan
97.4%
NURSERY SCHOOL
0.0/ 100
METRIC RATING
285th/ 347
METRIC RANK
97.7%
NURSERY SCHOOL
2.1/ 100
METRIC RATING
235th/ 347
METRIC RANK
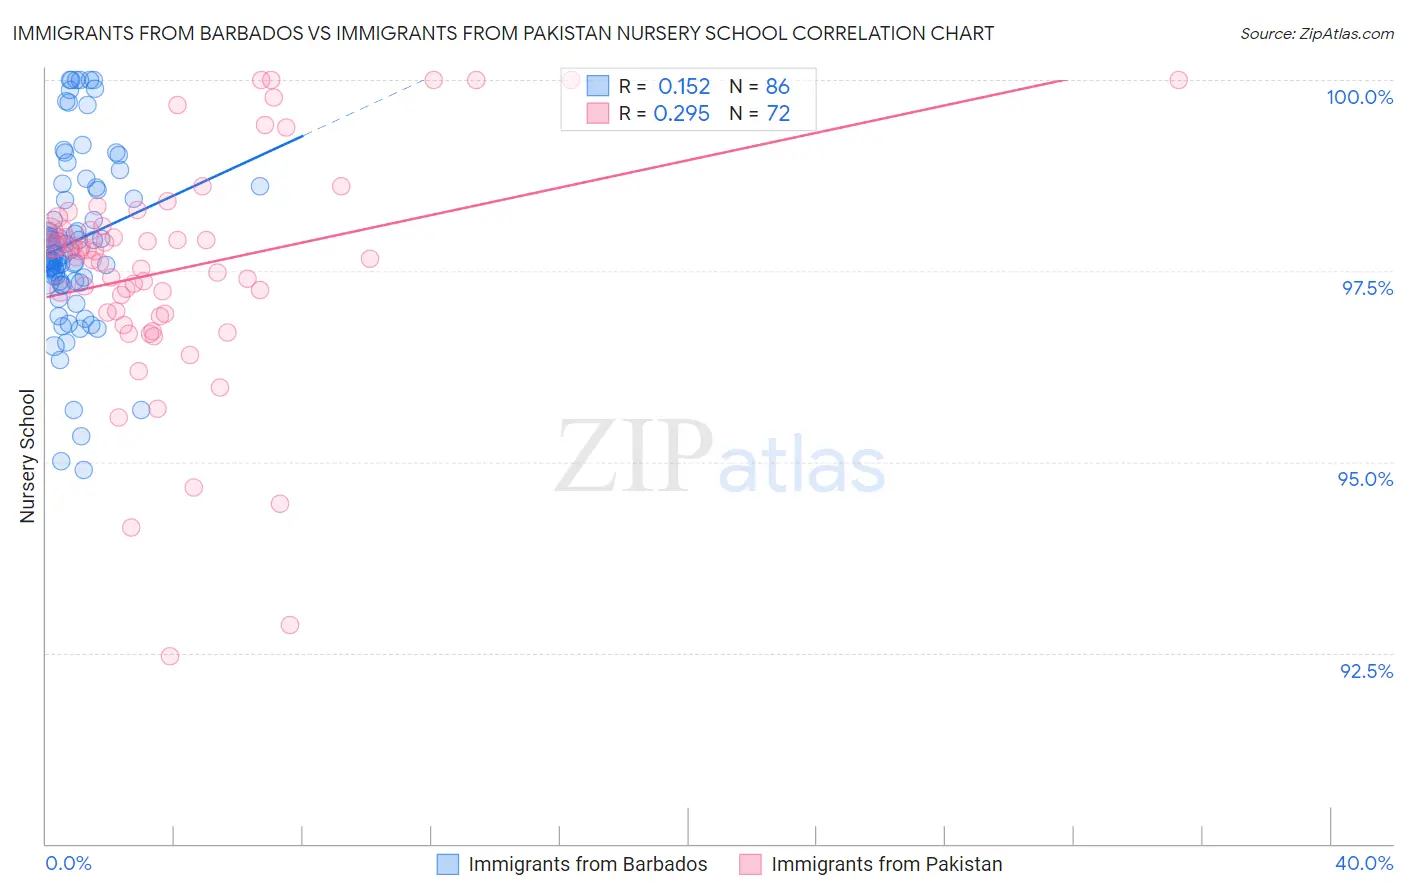
Immigrants from Barbados vs Immigrants from Pakistan Nursery School Correlation Chart
The statistical analysis conducted on geographies consisting of 112,787,503 people shows a poor positive correlation between the proportion of Immigrants from Barbados and percentage of population with at least nursery school education in the United States with a correlation coefficient (R) of 0.152 and weighted average of 97.4%. Similarly, the statistical analysis conducted on geographies consisting of 283,901,001 people shows a weak positive correlation between the proportion of Immigrants from Pakistan and percentage of population with at least nursery school education in the United States with a correlation coefficient (R) of 0.295 and weighted average of 97.7%, a difference of 0.35%.
Nursery School Correlation Summary
| Measurement | Immigrants from Barbados | Immigrants from Pakistan |
| Minimum | 94.9% | 92.5% |
| Maximum | 100.0% | 100.0% |
| Range | 5.1% | 7.5% |
| Mean | 97.9% | 97.5% |
| Median | 97.7% | 97.7% |
| Interquartile 25% (IQ1) | 97.4% | 96.9% |
| Interquartile 75% (IQ3) | 98.6% | 98.1% |
| Interquartile Range (IQR) | 1.2% | 1.1% |
| Standard Deviation (Sample) | 1.1% | 1.5% |
| Standard Deviation (Population) | 1.1% | 1.5% |
Similar Demographics by Nursery School
Demographics Similar to Immigrants from Barbados by Nursery School
In terms of nursery school, the demographic groups most similar to Immigrants from Barbados are Immigrants from Portugal (97.4%, a difference of 0.0%), Immigrants from Hong Kong (97.4%, a difference of 0.010%), Immigrants from West Indies (97.4%, a difference of 0.020%), Immigrants from Trinidad and Tobago (97.4%, a difference of 0.020%), and Immigrants from Thailand (97.3%, a difference of 0.030%).
| Demographics | Rating | Rank | Nursery School |
| Immigrants | Uzbekistan | 0.1 /100 | #278 | Tragic 97.4% |
| Immigrants | Ghana | 0.1 /100 | #279 | Tragic 97.4% |
| Barbadians | 0.0 /100 | #280 | Tragic 97.4% |
| Trinidadians and Tobagonians | 0.0 /100 | #281 | Tragic 97.4% |
| Afghans | 0.0 /100 | #282 | Tragic 97.4% |
| Immigrants | West Indies | 0.0 /100 | #283 | Tragic 97.4% |
| Immigrants | Trinidad and Tobago | 0.0 /100 | #284 | Tragic 97.4% |
| Immigrants | Barbados | 0.0 /100 | #285 | Tragic 97.4% |
| Immigrants | Portugal | 0.0 /100 | #286 | Tragic 97.4% |
| Immigrants | Hong Kong | 0.0 /100 | #287 | Tragic 97.4% |
| Immigrants | Thailand | 0.0 /100 | #288 | Tragic 97.3% |
| Immigrants | St. Vincent and the Grenadines | 0.0 /100 | #289 | Tragic 97.3% |
| Immigrants | Afghanistan | 0.0 /100 | #290 | Tragic 97.3% |
| British West Indians | 0.0 /100 | #291 | Tragic 97.3% |
| Houma | 0.0 /100 | #292 | Tragic 97.3% |
Demographics Similar to Immigrants from Pakistan by Nursery School
In terms of nursery school, the demographic groups most similar to Immigrants from Pakistan are U.S. Virgin Islander (97.7%, a difference of 0.0%), Colombian (97.7%, a difference of 0.0%), Immigrants from Uruguay (97.7%, a difference of 0.010%), Immigrants from Malaysia (97.7%, a difference of 0.010%), and Immigrants from Western Asia (97.7%, a difference of 0.010%).
| Demographics | Rating | Rank | Nursery School |
| Sudanese | 3.2 /100 | #228 | Tragic 97.7% |
| Senegalese | 3.2 /100 | #229 | Tragic 97.7% |
| Sierra Leoneans | 2.9 /100 | #230 | Tragic 97.7% |
| Puerto Ricans | 2.6 /100 | #231 | Tragic 97.7% |
| Immigrants | Uruguay | 2.3 /100 | #232 | Tragic 97.7% |
| U.S. Virgin Islanders | 2.1 /100 | #233 | Tragic 97.7% |
| Colombians | 2.1 /100 | #234 | Tragic 97.7% |
| Immigrants | Pakistan | 2.1 /100 | #235 | Tragic 97.7% |
| Immigrants | Malaysia | 1.9 /100 | #236 | Tragic 97.7% |
| Immigrants | Western Asia | 1.9 /100 | #237 | Tragic 97.7% |
| Nigerians | 1.7 /100 | #238 | Tragic 97.7% |
| Immigrants | Eastern Asia | 1.6 /100 | #239 | Tragic 97.7% |
| Koreans | 1.4 /100 | #240 | Tragic 97.7% |
| Immigrants | Indonesia | 1.1 /100 | #241 | Tragic 97.7% |
| Liberians | 1.1 /100 | #242 | Tragic 97.7% |