Immigrants from Barbados vs Immigrants from Ethiopia Unemployment
COMPARE
Immigrants from Barbados
Immigrants from Ethiopia
Unemployment
Unemployment Comparison
Immigrants from Barbados
Immigrants from Ethiopia
6.6%
UNEMPLOYMENT
0.0/ 100
METRIC RATING
313th/ 347
METRIC RANK
5.1%
UNEMPLOYMENT
86.7/ 100
METRIC RATING
132nd/ 347
METRIC RANK
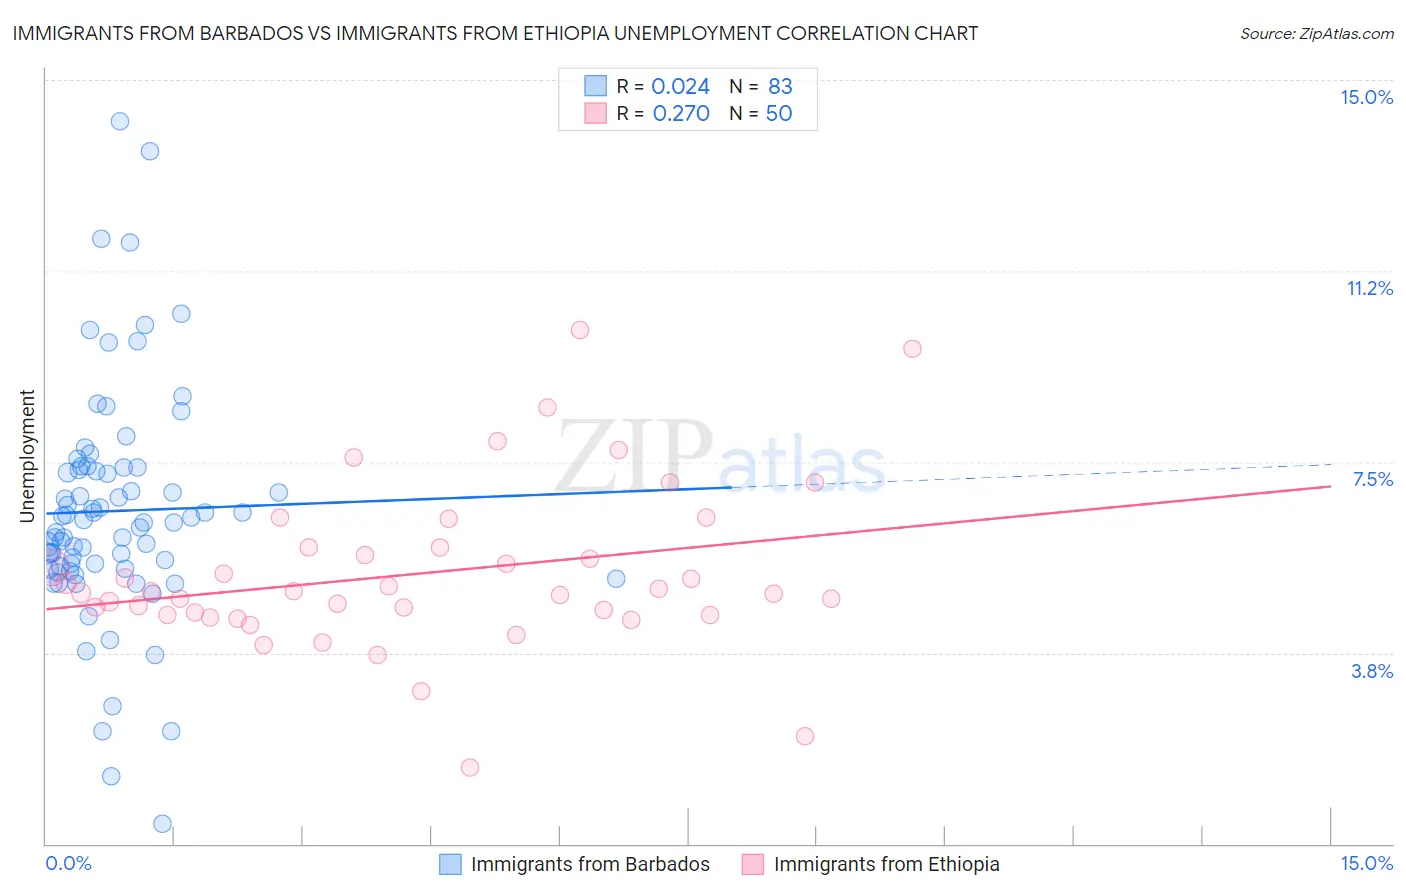
Immigrants from Barbados vs Immigrants from Ethiopia Unemployment Correlation Chart
The statistical analysis conducted on geographies consisting of 112,764,832 people shows no correlation between the proportion of Immigrants from Barbados and unemployment in the United States with a correlation coefficient (R) of 0.024 and weighted average of 6.6%. Similarly, the statistical analysis conducted on geographies consisting of 211,490,952 people shows a weak positive correlation between the proportion of Immigrants from Ethiopia and unemployment in the United States with a correlation coefficient (R) of 0.270 and weighted average of 5.1%, a difference of 29.2%.
Unemployment Correlation Summary
| Measurement | Immigrants from Barbados | Immigrants from Ethiopia |
| Minimum | 0.40% | 1.5% |
| Maximum | 14.2% | 10.1% |
| Range | 13.8% | 8.6% |
| Mean | 6.5% | 5.3% |
| Median | 6.3% | 4.9% |
| Interquartile 25% (IQ1) | 5.4% | 4.5% |
| Interquartile 75% (IQ3) | 7.4% | 5.8% |
| Interquartile Range (IQR) | 2.0% | 1.3% |
| Standard Deviation (Sample) | 2.3% | 1.6% |
| Standard Deviation (Population) | 2.3% | 1.6% |
Similar Demographics by Unemployment
Demographics Similar to Immigrants from Barbados by Unemployment
In terms of unemployment, the demographic groups most similar to Immigrants from Barbados are Colville (6.6%, a difference of 0.38%), Black/African American (6.6%, a difference of 0.55%), Cape Verdean (6.5%, a difference of 0.95%), Immigrants from Belize (6.5%, a difference of 1.3%), and Houma (6.7%, a difference of 1.3%).
| Demographics | Rating | Rank | Unemployment |
| Lumbee | 0.0 /100 | #306 | Tragic 6.4% |
| Immigrants | Bangladesh | 0.0 /100 | #307 | Tragic 6.5% |
| Barbadians | 0.0 /100 | #308 | Tragic 6.5% |
| Vietnamese | 0.0 /100 | #309 | Tragic 6.5% |
| Immigrants | Belize | 0.0 /100 | #310 | Tragic 6.5% |
| Cape Verdeans | 0.0 /100 | #311 | Tragic 6.5% |
| Colville | 0.0 /100 | #312 | Tragic 6.6% |
| Immigrants | Barbados | 0.0 /100 | #313 | Tragic 6.6% |
| Blacks/African Americans | 0.0 /100 | #314 | Tragic 6.6% |
| Houma | 0.0 /100 | #315 | Tragic 6.7% |
| Immigrants | Dominica | 0.0 /100 | #316 | Tragic 6.7% |
| Shoshone | 0.0 /100 | #317 | Tragic 6.8% |
| Immigrants | Cabo Verde | 0.0 /100 | #318 | Tragic 6.8% |
| British West Indians | 0.0 /100 | #319 | Tragic 6.8% |
| Immigrants | St. Vincent and the Grenadines | 0.0 /100 | #320 | Tragic 6.9% |
Demographics Similar to Immigrants from Ethiopia by Unemployment
In terms of unemployment, the demographic groups most similar to Immigrants from Ethiopia are Immigrants from Croatia (5.1%, a difference of 0.010%), Immigrants from Jordan (5.1%, a difference of 0.010%), Iranian (5.1%, a difference of 0.030%), Immigrants from Europe (5.1%, a difference of 0.050%), and Immigrants from Burma/Myanmar (5.1%, a difference of 0.060%).
| Demographics | Rating | Rank | Unemployment |
| Immigrants | Eastern Asia | 88.3 /100 | #125 | Excellent 5.1% |
| Kenyans | 88.2 /100 | #126 | Excellent 5.1% |
| Immigrants | Kenya | 88.2 /100 | #127 | Excellent 5.1% |
| Immigrants | Eastern Africa | 88.1 /100 | #128 | Excellent 5.1% |
| Immigrants | Latvia | 88.0 /100 | #129 | Excellent 5.1% |
| Iranians | 86.9 /100 | #130 | Excellent 5.1% |
| Immigrants | Croatia | 86.8 /100 | #131 | Excellent 5.1% |
| Immigrants | Ethiopia | 86.7 /100 | #132 | Excellent 5.1% |
| Immigrants | Jordan | 86.6 /100 | #133 | Excellent 5.1% |
| Immigrants | Europe | 86.3 /100 | #134 | Excellent 5.1% |
| Immigrants | Burma/Myanmar | 86.2 /100 | #135 | Excellent 5.1% |
| Immigrants | Spain | 86.2 /100 | #136 | Excellent 5.1% |
| Immigrants | Saudi Arabia | 85.6 /100 | #137 | Excellent 5.1% |
| Immigrants | Hungary | 85.6 /100 | #138 | Excellent 5.1% |
| Pakistanis | 85.3 /100 | #139 | Excellent 5.1% |