Immigrants from Barbados vs Yup'ik Unemployment
COMPARE
Immigrants from Barbados
Yup'ik
Unemployment
Unemployment Comparison
Immigrants from Barbados
Yup'ik
6.6%
UNEMPLOYMENT
0.0/ 100
METRIC RATING
313th/ 347
METRIC RANK
13.6%
UNEMPLOYMENT
0.0/ 100
METRIC RATING
347th/ 347
METRIC RANK
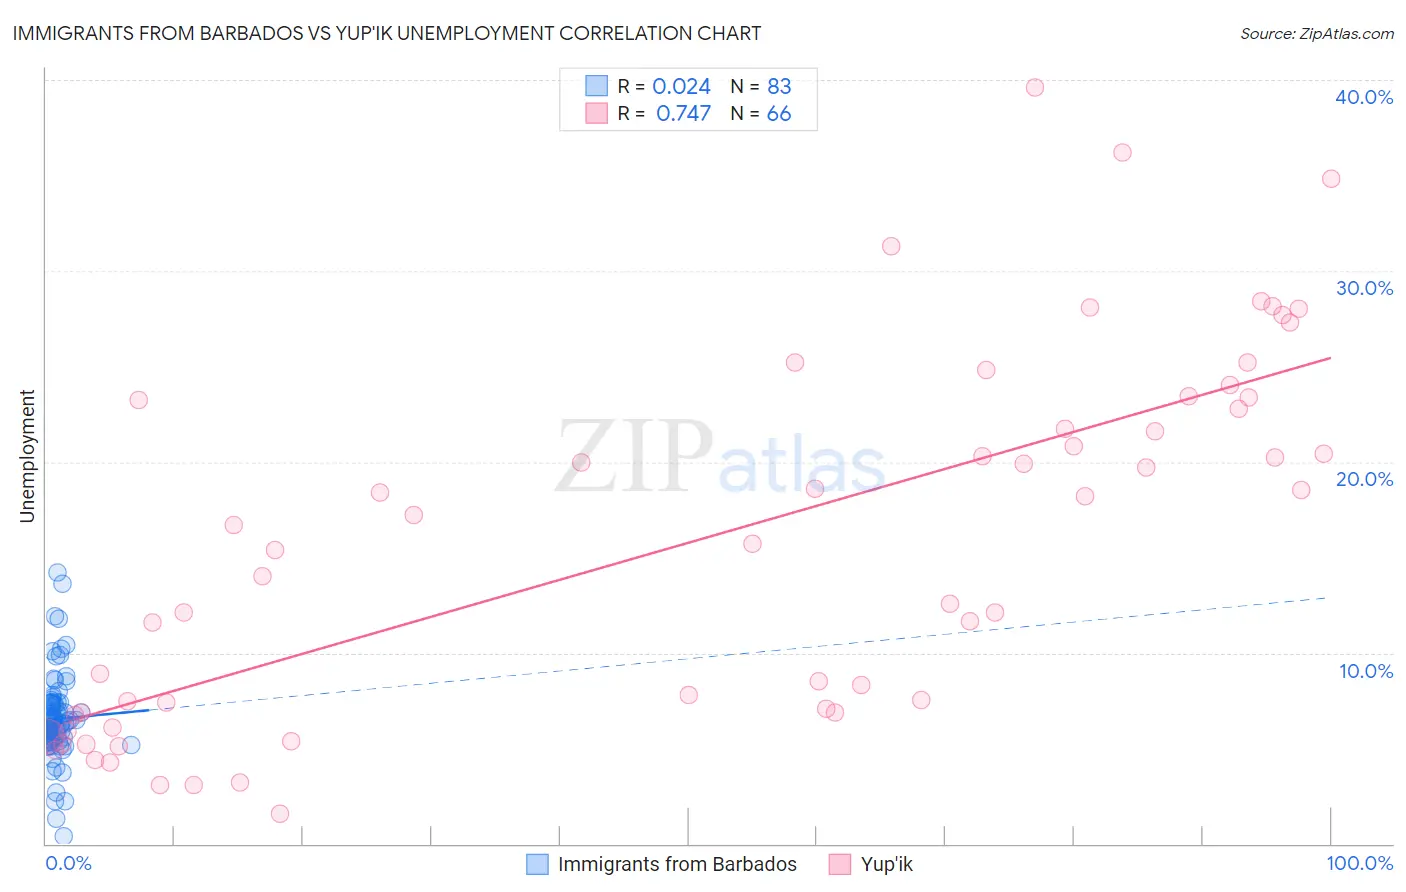
Immigrants from Barbados vs Yup'ik Unemployment Correlation Chart
The statistical analysis conducted on geographies consisting of 112,764,832 people shows no correlation between the proportion of Immigrants from Barbados and unemployment in the United States with a correlation coefficient (R) of 0.024 and weighted average of 6.6%. Similarly, the statistical analysis conducted on geographies consisting of 39,958,223 people shows a strong positive correlation between the proportion of Yup'ik and unemployment in the United States with a correlation coefficient (R) of 0.747 and weighted average of 13.6%, a difference of 106.8%.
Unemployment Correlation Summary
| Measurement | Immigrants from Barbados | Yup'ik |
| Minimum | 0.40% | 1.6% |
| Maximum | 14.2% | 39.6% |
| Range | 13.8% | 38.0% |
| Mean | 6.5% | 15.8% |
| Median | 6.3% | 16.2% |
| Interquartile 25% (IQ1) | 5.4% | 6.9% |
| Interquartile 75% (IQ3) | 7.4% | 23.2% |
| Interquartile Range (IQR) | 2.0% | 16.3% |
| Standard Deviation (Sample) | 2.3% | 9.5% |
| Standard Deviation (Population) | 2.3% | 9.4% |
Similar Demographics by Unemployment
Demographics Similar to Immigrants from Barbados by Unemployment
In terms of unemployment, the demographic groups most similar to Immigrants from Barbados are Colville (6.6%, a difference of 0.38%), Black/African American (6.6%, a difference of 0.55%), Cape Verdean (6.5%, a difference of 0.95%), Immigrants from Belize (6.5%, a difference of 1.3%), and Houma (6.7%, a difference of 1.3%).
| Demographics | Rating | Rank | Unemployment |
| Lumbee | 0.0 /100 | #306 | Tragic 6.4% |
| Immigrants | Bangladesh | 0.0 /100 | #307 | Tragic 6.5% |
| Barbadians | 0.0 /100 | #308 | Tragic 6.5% |
| Vietnamese | 0.0 /100 | #309 | Tragic 6.5% |
| Immigrants | Belize | 0.0 /100 | #310 | Tragic 6.5% |
| Cape Verdeans | 0.0 /100 | #311 | Tragic 6.5% |
| Colville | 0.0 /100 | #312 | Tragic 6.6% |
| Immigrants | Barbados | 0.0 /100 | #313 | Tragic 6.6% |
| Blacks/African Americans | 0.0 /100 | #314 | Tragic 6.6% |
| Houma | 0.0 /100 | #315 | Tragic 6.7% |
| Immigrants | Dominica | 0.0 /100 | #316 | Tragic 6.7% |
| Shoshone | 0.0 /100 | #317 | Tragic 6.8% |
| Immigrants | Cabo Verde | 0.0 /100 | #318 | Tragic 6.8% |
| British West Indians | 0.0 /100 | #319 | Tragic 6.8% |
| Immigrants | St. Vincent and the Grenadines | 0.0 /100 | #320 | Tragic 6.9% |
Demographics Similar to Yup'ik by Unemployment
In terms of unemployment, the demographic groups most similar to Yup'ik are Crow (11.1%, a difference of 23.3%), Inupiat (10.1%, a difference of 34.8%), Arapaho (9.8%, a difference of 38.8%), Yuman (9.1%, a difference of 50.4%), and Hopi (8.9%, a difference of 53.0%).
| Demographics | Rating | Rank | Unemployment |
| Immigrants | Dominican Republic | 0.0 /100 | #333 | Tragic 7.4% |
| Apache | 0.0 /100 | #334 | Tragic 7.4% |
| Alaskan Athabascans | 0.0 /100 | #335 | Tragic 7.7% |
| Immigrants | Yemen | 0.0 /100 | #336 | Tragic 7.7% |
| Cheyenne | 0.0 /100 | #337 | Tragic 8.0% |
| Pima | 0.0 /100 | #338 | Tragic 8.2% |
| Navajo | 0.0 /100 | #339 | Tragic 8.4% |
| Puerto Ricans | 0.0 /100 | #340 | Tragic 8.4% |
| Tohono O'odham | 0.0 /100 | #341 | Tragic 8.9% |
| Hopi | 0.0 /100 | #342 | Tragic 8.9% |
| Yuman | 0.0 /100 | #343 | Tragic 9.1% |
| Arapaho | 0.0 /100 | #344 | Tragic 9.8% |
| Inupiat | 0.0 /100 | #345 | Tragic 10.1% |
| Crow | 0.0 /100 | #346 | Tragic 11.1% |
| Yup'ik | 0.0 /100 | #347 | Tragic 13.6% |