Immigrants from Barbados vs Immigrants from Pakistan Householder Income Ages 25 - 44 years
COMPARE
Immigrants from Barbados
Immigrants from Pakistan
Householder Income Ages 25 - 44 years
Householder Income Ages 25 - 44 years Comparison
Immigrants from Barbados
Immigrants from Pakistan
$88,687
HOUSEHOLDER INCOME AGES 25 - 44 YEARS
3.7/ 100
METRIC RATING
229th/ 347
METRIC RANK
$106,129
HOUSEHOLDER INCOME AGES 25 - 44 YEARS
99.8/ 100
METRIC RATING
56th/ 347
METRIC RANK
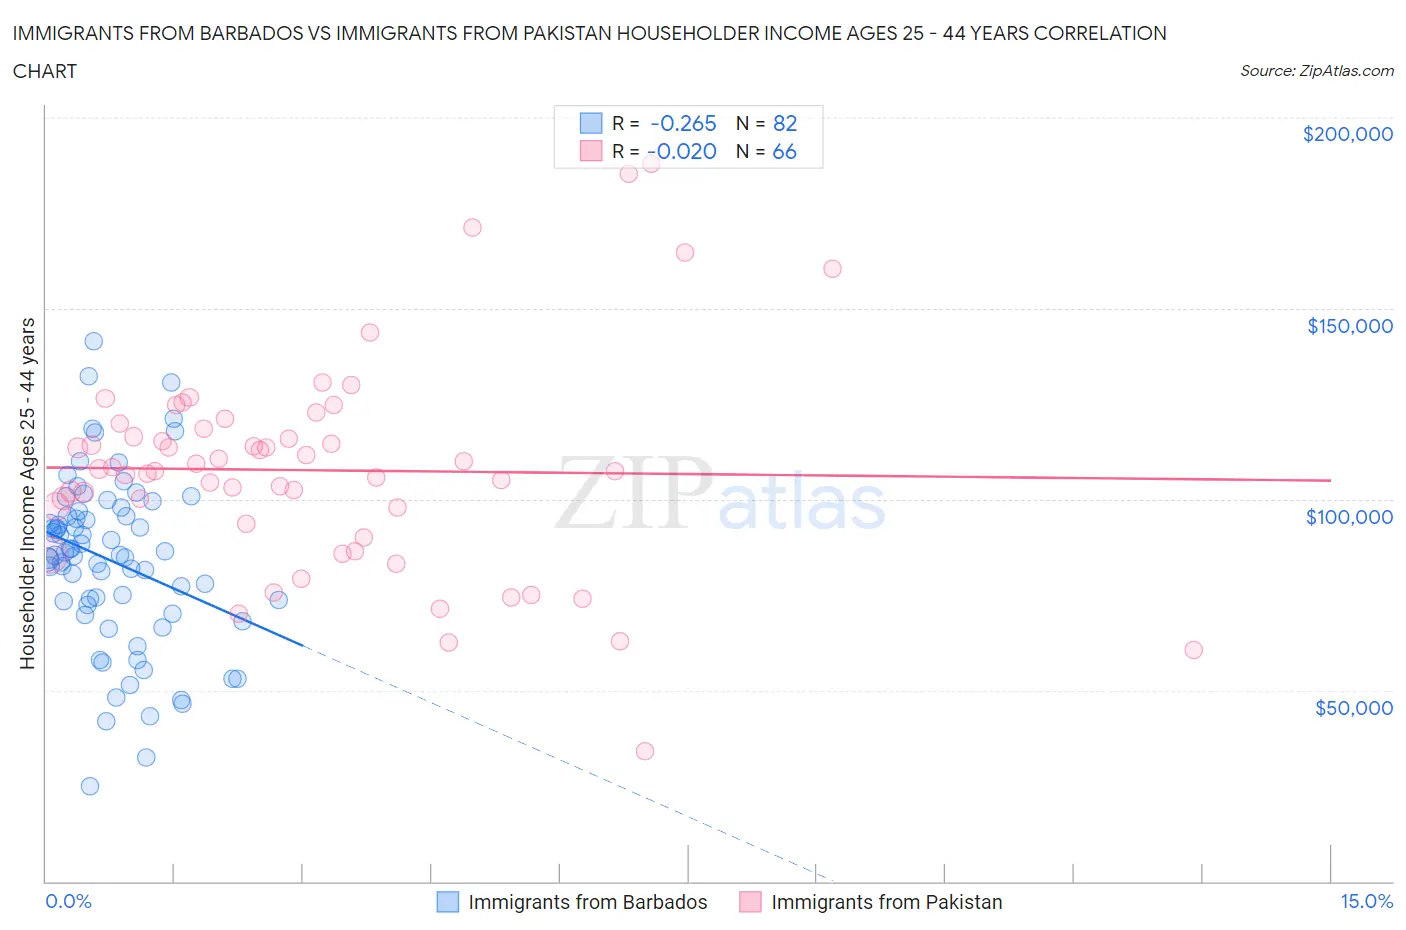
Immigrants from Barbados vs Immigrants from Pakistan Householder Income Ages 25 - 44 years Correlation Chart
The statistical analysis conducted on geographies consisting of 112,714,156 people shows a weak negative correlation between the proportion of Immigrants from Barbados and household income with householder between the ages 25 and 44 in the United States with a correlation coefficient (R) of -0.265 and weighted average of $88,687. Similarly, the statistical analysis conducted on geographies consisting of 283,570,722 people shows no correlation between the proportion of Immigrants from Pakistan and household income with householder between the ages 25 and 44 in the United States with a correlation coefficient (R) of -0.020 and weighted average of $106,129, a difference of 19.7%.
Householder Income Ages 25 - 44 years Correlation Summary
| Measurement | Immigrants from Barbados | Immigrants from Pakistan |
| Minimum | $24,836 | $34,000 |
| Maximum | $141,528 | $187,880 |
| Range | $116,692 | $153,880 |
| Mean | $83,858 | $107,614 |
| Median | $85,381 | $107,714 |
| Interquartile 25% (IQ1) | $72,198 | $93,459 |
| Interquartile 75% (IQ3) | $95,727 | $118,512 |
| Interquartile Range (IQR) | $23,529 | $25,052 |
| Standard Deviation (Sample) | $22,403 | $27,793 |
| Standard Deviation (Population) | $22,266 | $27,582 |
Similar Demographics by Householder Income Ages 25 - 44 years
Demographics Similar to Immigrants from Barbados by Householder Income Ages 25 - 44 years
In terms of householder income ages 25 - 44 years, the demographic groups most similar to Immigrants from Barbados are Immigrants from Bosnia and Herzegovina ($88,819, a difference of 0.15%), Immigrants from St. Vincent and the Grenadines ($88,888, a difference of 0.23%), Alaskan Athabascan ($88,446, a difference of 0.27%), Immigrants from Grenada ($88,311, a difference of 0.43%), and Nonimmigrants ($88,301, a difference of 0.44%).
| Demographics | Rating | Rank | Householder Income Ages 25 - 44 years |
| Immigrants | Ecuador | 6.2 /100 | #222 | Tragic $89,673 |
| Immigrants | Guyana | 5.9 /100 | #223 | Tragic $89,586 |
| Barbadians | 5.9 /100 | #224 | Tragic $89,565 |
| Immigrants | Panama | 5.5 /100 | #225 | Tragic $89,451 |
| Immigrants | Iraq | 5.5 /100 | #226 | Tragic $89,444 |
| Immigrants | St. Vincent and the Grenadines | 4.1 /100 | #227 | Tragic $88,888 |
| Immigrants | Bosnia and Herzegovina | 4.0 /100 | #228 | Tragic $88,819 |
| Immigrants | Barbados | 3.7 /100 | #229 | Tragic $88,687 |
| Alaskan Athabascans | 3.3 /100 | #230 | Tragic $88,446 |
| Immigrants | Grenada | 3.0 /100 | #231 | Tragic $88,311 |
| Immigrants | Nonimmigrants | 3.0 /100 | #232 | Tragic $88,301 |
| Malaysians | 3.0 /100 | #233 | Tragic $88,291 |
| Venezuelans | 2.9 /100 | #234 | Tragic $88,232 |
| Bermudans | 2.9 /100 | #235 | Tragic $88,231 |
| Immigrants | Cameroon | 2.9 /100 | #236 | Tragic $88,214 |
Demographics Similar to Immigrants from Pakistan by Householder Income Ages 25 - 44 years
In terms of householder income ages 25 - 44 years, the demographic groups most similar to Immigrants from Pakistan are Immigrants from Austria ($106,103, a difference of 0.030%), Greek ($106,457, a difference of 0.31%), Immigrants from South Africa ($105,748, a difference of 0.36%), Paraguayan ($106,615, a difference of 0.46%), and Immigrants from Norway ($106,629, a difference of 0.47%).
| Demographics | Rating | Rank | Householder Income Ages 25 - 44 years |
| Immigrants | Turkey | 99.9 /100 | #49 | Exceptional $107,258 |
| Cambodians | 99.9 /100 | #50 | Exceptional $107,148 |
| Immigrants | Czechoslovakia | 99.9 /100 | #51 | Exceptional $106,888 |
| Immigrants | Europe | 99.9 /100 | #52 | Exceptional $106,817 |
| Immigrants | Norway | 99.9 /100 | #53 | Exceptional $106,629 |
| Paraguayans | 99.9 /100 | #54 | Exceptional $106,615 |
| Greeks | 99.9 /100 | #55 | Exceptional $106,457 |
| Immigrants | Pakistan | 99.8 /100 | #56 | Exceptional $106,129 |
| Immigrants | Austria | 99.8 /100 | #57 | Exceptional $106,103 |
| Immigrants | South Africa | 99.8 /100 | #58 | Exceptional $105,748 |
| Immigrants | Latvia | 99.8 /100 | #59 | Exceptional $105,522 |
| Egyptians | 99.7 /100 | #60 | Exceptional $105,282 |
| Lithuanians | 99.7 /100 | #61 | Exceptional $105,223 |
| Immigrants | Italy | 99.7 /100 | #62 | Exceptional $105,201 |
| Immigrants | Scotland | 99.7 /100 | #63 | Exceptional $105,089 |