Immigrants from Barbados vs Eastern European Unemployment
COMPARE
Immigrants from Barbados
Eastern European
Unemployment
Unemployment Comparison
Immigrants from Barbados
Eastern Europeans
6.6%
UNEMPLOYMENT
0.0/ 100
METRIC RATING
313th/ 347
METRIC RANK
4.9%
UNEMPLOYMENT
99.2/ 100
METRIC RATING
54th/ 347
METRIC RANK
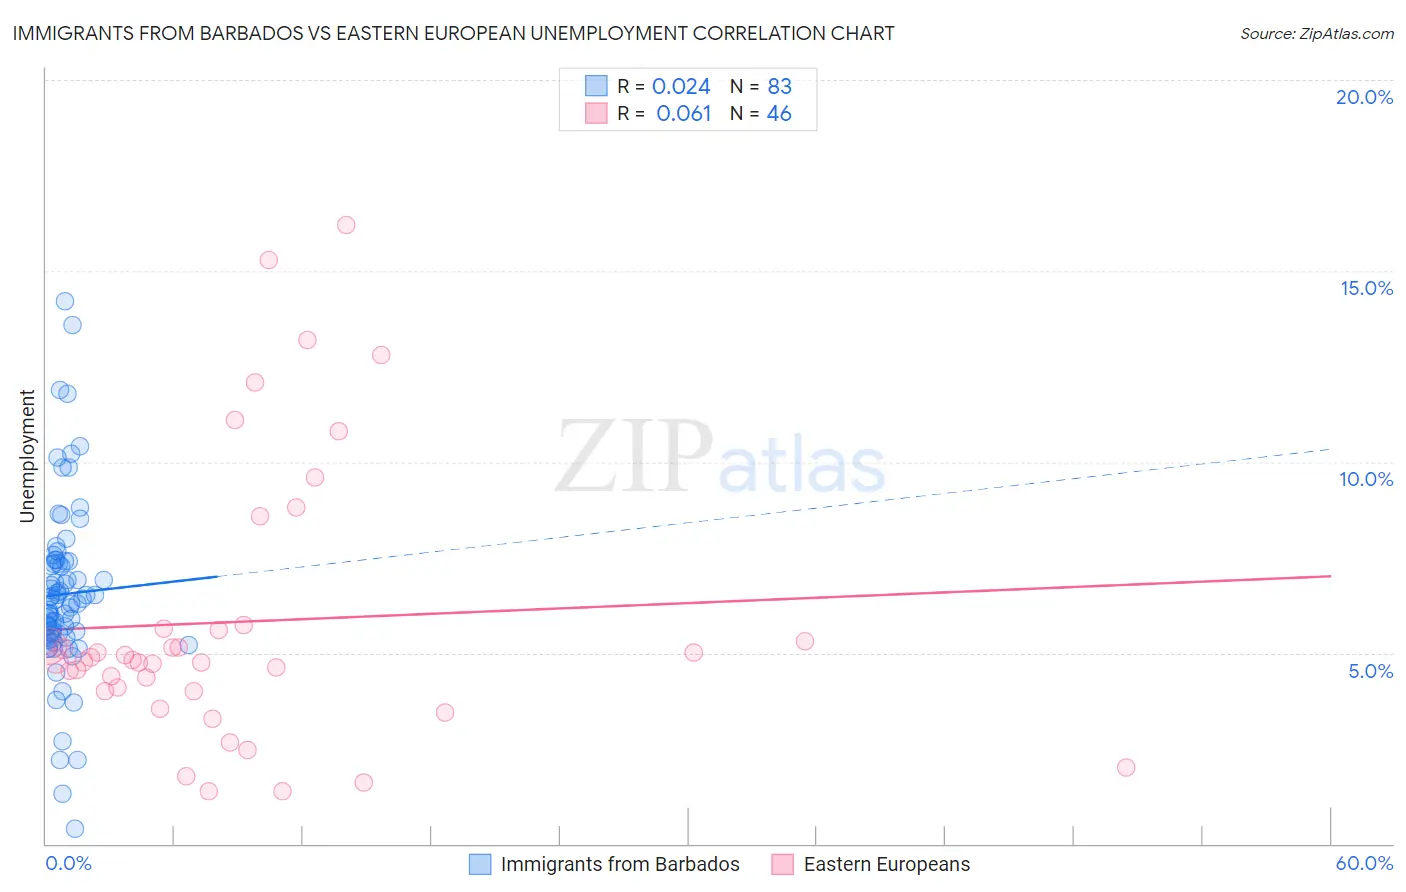
Immigrants from Barbados vs Eastern European Unemployment Correlation Chart
The statistical analysis conducted on geographies consisting of 112,764,832 people shows no correlation between the proportion of Immigrants from Barbados and unemployment in the United States with a correlation coefficient (R) of 0.024 and weighted average of 6.6%. Similarly, the statistical analysis conducted on geographies consisting of 460,325,858 people shows a slight positive correlation between the proportion of Eastern Europeans and unemployment in the United States with a correlation coefficient (R) of 0.061 and weighted average of 4.9%, a difference of 35.5%.
Unemployment Correlation Summary
| Measurement | Immigrants from Barbados | Eastern European |
| Minimum | 0.40% | 1.4% |
| Maximum | 14.2% | 16.2% |
| Range | 13.8% | 14.8% |
| Mean | 6.5% | 5.8% |
| Median | 6.3% | 4.8% |
| Interquartile 25% (IQ1) | 5.4% | 4.0% |
| Interquartile 75% (IQ3) | 7.4% | 5.6% |
| Interquartile Range (IQR) | 2.0% | 1.6% |
| Standard Deviation (Sample) | 2.3% | 3.6% |
| Standard Deviation (Population) | 2.3% | 3.6% |
Similar Demographics by Unemployment
Demographics Similar to Immigrants from Barbados by Unemployment
In terms of unemployment, the demographic groups most similar to Immigrants from Barbados are Colville (6.6%, a difference of 0.38%), Black/African American (6.6%, a difference of 0.55%), Cape Verdean (6.5%, a difference of 0.95%), Immigrants from Belize (6.5%, a difference of 1.3%), and Houma (6.7%, a difference of 1.3%).
| Demographics | Rating | Rank | Unemployment |
| Lumbee | 0.0 /100 | #306 | Tragic 6.4% |
| Immigrants | Bangladesh | 0.0 /100 | #307 | Tragic 6.5% |
| Barbadians | 0.0 /100 | #308 | Tragic 6.5% |
| Vietnamese | 0.0 /100 | #309 | Tragic 6.5% |
| Immigrants | Belize | 0.0 /100 | #310 | Tragic 6.5% |
| Cape Verdeans | 0.0 /100 | #311 | Tragic 6.5% |
| Colville | 0.0 /100 | #312 | Tragic 6.6% |
| Immigrants | Barbados | 0.0 /100 | #313 | Tragic 6.6% |
| Blacks/African Americans | 0.0 /100 | #314 | Tragic 6.6% |
| Houma | 0.0 /100 | #315 | Tragic 6.7% |
| Immigrants | Dominica | 0.0 /100 | #316 | Tragic 6.7% |
| Shoshone | 0.0 /100 | #317 | Tragic 6.8% |
| Immigrants | Cabo Verde | 0.0 /100 | #318 | Tragic 6.8% |
| British West Indians | 0.0 /100 | #319 | Tragic 6.8% |
| Immigrants | St. Vincent and the Grenadines | 0.0 /100 | #320 | Tragic 6.9% |
Demographics Similar to Eastern Europeans by Unemployment
In terms of unemployment, the demographic groups most similar to Eastern Europeans are Immigrants from Zimbabwe (4.9%, a difference of 0.030%), Australian (4.9%, a difference of 0.030%), White/Caucasian (4.9%, a difference of 0.060%), Immigrants from Belgium (4.9%, a difference of 0.070%), and Celtic (4.9%, a difference of 0.19%).
| Demographics | Rating | Rank | Unemployment |
| Immigrants | Taiwan | 99.4 /100 | #47 | Exceptional 4.8% |
| Immigrants | Scotland | 99.3 /100 | #48 | Exceptional 4.9% |
| Immigrants | South Central Asia | 99.3 /100 | #49 | Exceptional 4.9% |
| French Canadians | 99.3 /100 | #50 | Exceptional 4.9% |
| Immigrants | Belgium | 99.2 /100 | #51 | Exceptional 4.9% |
| Whites/Caucasians | 99.2 /100 | #52 | Exceptional 4.9% |
| Immigrants | Zimbabwe | 99.2 /100 | #53 | Exceptional 4.9% |
| Eastern Europeans | 99.2 /100 | #54 | Exceptional 4.9% |
| Australians | 99.2 /100 | #55 | Exceptional 4.9% |
| Celtics | 99.1 /100 | #56 | Exceptional 4.9% |
| Immigrants | Singapore | 99.1 /100 | #57 | Exceptional 4.9% |
| Greeks | 99.0 /100 | #58 | Exceptional 4.9% |
| Bhutanese | 99.0 /100 | #59 | Exceptional 4.9% |
| Immigrants | Netherlands | 99.0 /100 | #60 | Exceptional 4.9% |
| Cambodians | 99.0 /100 | #61 | Exceptional 4.9% |