Immigrants from Barbados vs Cheyenne Unemployment
COMPARE
Immigrants from Barbados
Cheyenne
Unemployment
Unemployment Comparison
Immigrants from Barbados
Cheyenne
6.6%
UNEMPLOYMENT
0.0/ 100
METRIC RATING
313th/ 347
METRIC RANK
8.0%
UNEMPLOYMENT
0.0/ 100
METRIC RATING
337th/ 347
METRIC RANK
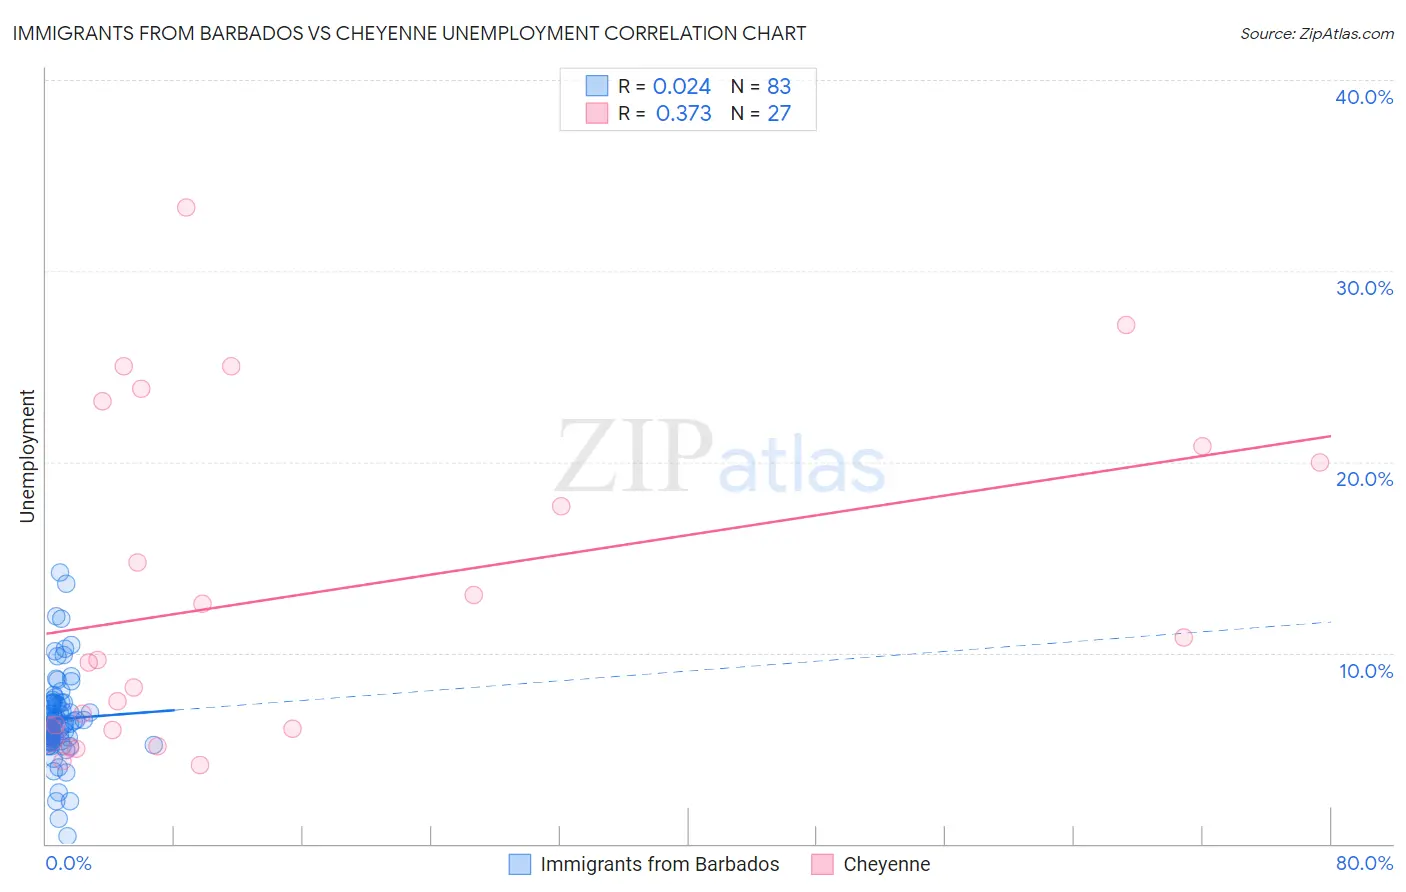
Immigrants from Barbados vs Cheyenne Unemployment Correlation Chart
The statistical analysis conducted on geographies consisting of 112,764,832 people shows no correlation between the proportion of Immigrants from Barbados and unemployment in the United States with a correlation coefficient (R) of 0.024 and weighted average of 6.6%. Similarly, the statistical analysis conducted on geographies consisting of 80,656,490 people shows a mild positive correlation between the proportion of Cheyenne and unemployment in the United States with a correlation coefficient (R) of 0.373 and weighted average of 8.0%, a difference of 21.3%.
Unemployment Correlation Summary
| Measurement | Immigrants from Barbados | Cheyenne |
| Minimum | 0.40% | 4.1% |
| Maximum | 14.2% | 33.3% |
| Range | 13.8% | 29.2% |
| Mean | 6.5% | 13.2% |
| Median | 6.3% | 9.6% |
| Interquartile 25% (IQ1) | 5.4% | 6.0% |
| Interquartile 75% (IQ3) | 7.4% | 20.8% |
| Interquartile Range (IQR) | 2.0% | 14.8% |
| Standard Deviation (Sample) | 2.3% | 8.6% |
| Standard Deviation (Population) | 2.3% | 8.4% |
Similar Demographics by Unemployment
Demographics Similar to Immigrants from Barbados by Unemployment
In terms of unemployment, the demographic groups most similar to Immigrants from Barbados are Colville (6.6%, a difference of 0.38%), Black/African American (6.6%, a difference of 0.55%), Cape Verdean (6.5%, a difference of 0.95%), Immigrants from Belize (6.5%, a difference of 1.3%), and Houma (6.7%, a difference of 1.3%).
| Demographics | Rating | Rank | Unemployment |
| Lumbee | 0.0 /100 | #306 | Tragic 6.4% |
| Immigrants | Bangladesh | 0.0 /100 | #307 | Tragic 6.5% |
| Barbadians | 0.0 /100 | #308 | Tragic 6.5% |
| Vietnamese | 0.0 /100 | #309 | Tragic 6.5% |
| Immigrants | Belize | 0.0 /100 | #310 | Tragic 6.5% |
| Cape Verdeans | 0.0 /100 | #311 | Tragic 6.5% |
| Colville | 0.0 /100 | #312 | Tragic 6.6% |
| Immigrants | Barbados | 0.0 /100 | #313 | Tragic 6.6% |
| Blacks/African Americans | 0.0 /100 | #314 | Tragic 6.6% |
| Houma | 0.0 /100 | #315 | Tragic 6.7% |
| Immigrants | Dominica | 0.0 /100 | #316 | Tragic 6.7% |
| Shoshone | 0.0 /100 | #317 | Tragic 6.8% |
| Immigrants | Cabo Verde | 0.0 /100 | #318 | Tragic 6.8% |
| British West Indians | 0.0 /100 | #319 | Tragic 6.8% |
| Immigrants | St. Vincent and the Grenadines | 0.0 /100 | #320 | Tragic 6.9% |
Demographics Similar to Cheyenne by Unemployment
In terms of unemployment, the demographic groups most similar to Cheyenne are Pima (8.2%, a difference of 2.8%), Immigrants from Yemen (7.7%, a difference of 3.8%), Navajo (8.4%, a difference of 4.4%), Alaskan Athabascan (7.7%, a difference of 4.6%), and Puerto Rican (8.4%, a difference of 5.2%).
| Demographics | Rating | Rank | Unemployment |
| Yakama | 0.0 /100 | #330 | Tragic 7.3% |
| Dominicans | 0.0 /100 | #331 | Tragic 7.4% |
| Sioux | 0.0 /100 | #332 | Tragic 7.4% |
| Immigrants | Dominican Republic | 0.0 /100 | #333 | Tragic 7.4% |
| Apache | 0.0 /100 | #334 | Tragic 7.4% |
| Alaskan Athabascans | 0.0 /100 | #335 | Tragic 7.7% |
| Immigrants | Yemen | 0.0 /100 | #336 | Tragic 7.7% |
| Cheyenne | 0.0 /100 | #337 | Tragic 8.0% |
| Pima | 0.0 /100 | #338 | Tragic 8.2% |
| Navajo | 0.0 /100 | #339 | Tragic 8.4% |
| Puerto Ricans | 0.0 /100 | #340 | Tragic 8.4% |
| Tohono O'odham | 0.0 /100 | #341 | Tragic 8.9% |
| Hopi | 0.0 /100 | #342 | Tragic 8.9% |
| Yuman | 0.0 /100 | #343 | Tragic 9.1% |
| Arapaho | 0.0 /100 | #344 | Tragic 9.8% |