Immigrants from Barbados vs Belizean Unemployment
COMPARE
Immigrants from Barbados
Belizean
Unemployment
Unemployment Comparison
Immigrants from Barbados
Belizeans
6.6%
UNEMPLOYMENT
0.0/ 100
METRIC RATING
313th/ 347
METRIC RANK
6.4%
UNEMPLOYMENT
0.0/ 100
METRIC RATING
303rd/ 347
METRIC RANK
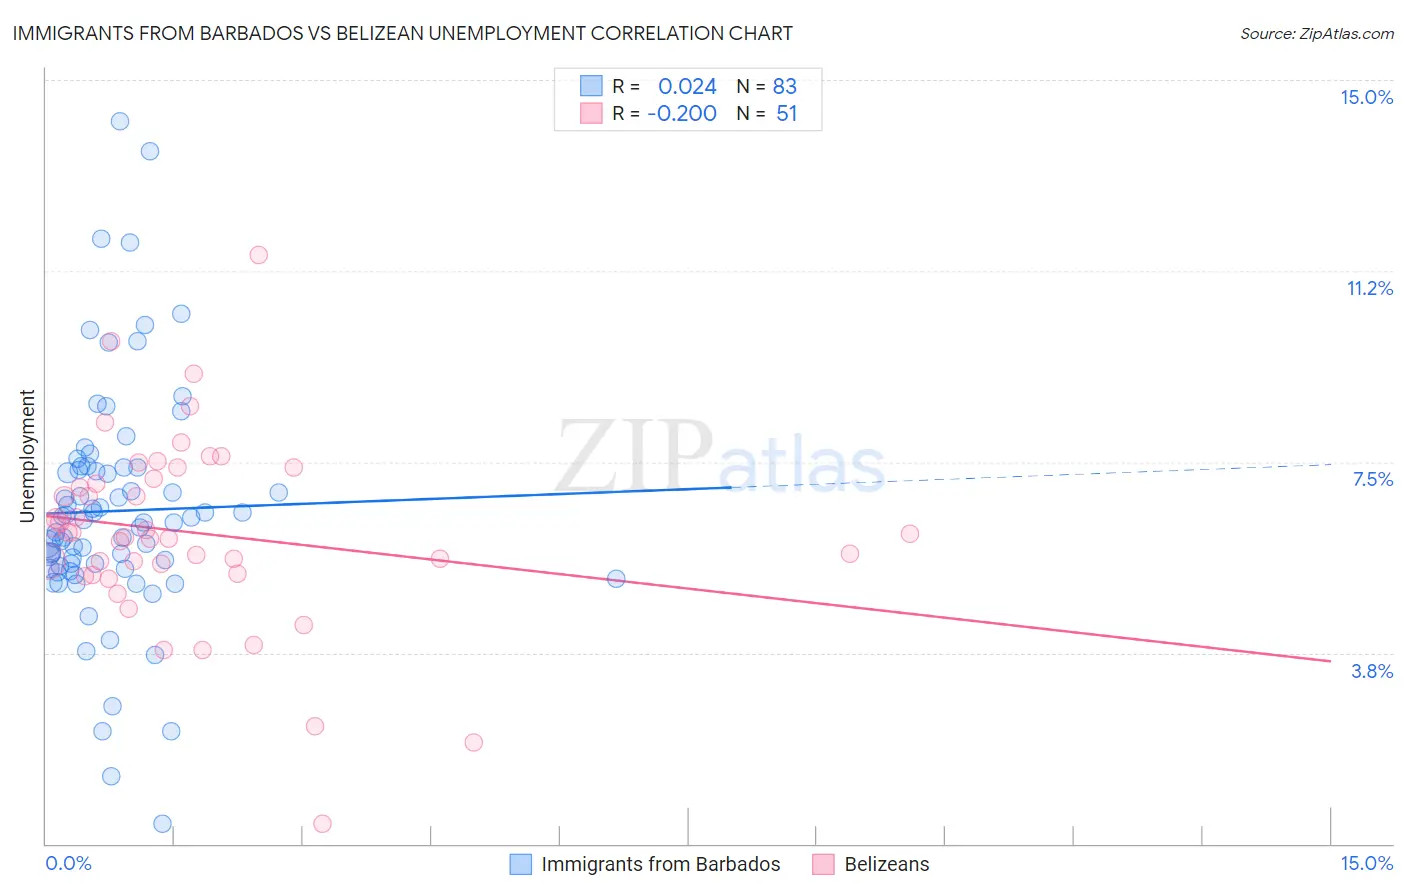
Immigrants from Barbados vs Belizean Unemployment Correlation Chart
The statistical analysis conducted on geographies consisting of 112,764,832 people shows no correlation between the proportion of Immigrants from Barbados and unemployment in the United States with a correlation coefficient (R) of 0.024 and weighted average of 6.6%. Similarly, the statistical analysis conducted on geographies consisting of 144,164,887 people shows a poor negative correlation between the proportion of Belizeans and unemployment in the United States with a correlation coefficient (R) of -0.200 and weighted average of 6.4%, a difference of 3.4%.
Unemployment Correlation Summary
| Measurement | Immigrants from Barbados | Belizean |
| Minimum | 0.40% | 0.40% |
| Maximum | 14.2% | 11.6% |
| Range | 13.8% | 11.2% |
| Mean | 6.5% | 6.1% |
| Median | 6.3% | 6.1% |
| Interquartile 25% (IQ1) | 5.4% | 5.3% |
| Interquartile 75% (IQ3) | 7.4% | 7.2% |
| Interquartile Range (IQR) | 2.0% | 1.9% |
| Standard Deviation (Sample) | 2.3% | 1.9% |
| Standard Deviation (Population) | 2.3% | 1.9% |
Demographics Similar to Immigrants from Barbados and Belizeans by Unemployment
In terms of unemployment, the demographic groups most similar to Immigrants from Barbados are Colville (6.6%, a difference of 0.38%), Black/African American (6.6%, a difference of 0.55%), Cape Verdean (6.5%, a difference of 0.95%), Immigrants from Belize (6.5%, a difference of 1.3%), and Houma (6.7%, a difference of 1.3%). Similarly, the demographic groups most similar to Belizeans are West Indian (6.4%, a difference of 0.23%), Trinidadian and Tobagonian (6.3%, a difference of 0.48%), Immigrants from Jamaica (6.4%, a difference of 0.68%), Menominee (6.4%, a difference of 0.93%), and Immigrants from Trinidad and Tobago (6.3%, a difference of 0.97%).
| Demographics | Rating | Rank | Unemployment |
| Immigrants | Haiti | 0.0 /100 | #298 | Tragic 6.3% |
| Immigrants | West Indies | 0.0 /100 | #299 | Tragic 6.3% |
| Immigrants | Trinidad and Tobago | 0.0 /100 | #300 | Tragic 6.3% |
| Trinidadians and Tobagonians | 0.0 /100 | #301 | Tragic 6.3% |
| West Indians | 0.0 /100 | #302 | Tragic 6.4% |
| Belizeans | 0.0 /100 | #303 | Tragic 6.4% |
| Immigrants | Jamaica | 0.0 /100 | #304 | Tragic 6.4% |
| Menominee | 0.0 /100 | #305 | Tragic 6.4% |
| Lumbee | 0.0 /100 | #306 | Tragic 6.4% |
| Immigrants | Bangladesh | 0.0 /100 | #307 | Tragic 6.5% |
| Barbadians | 0.0 /100 | #308 | Tragic 6.5% |
| Vietnamese | 0.0 /100 | #309 | Tragic 6.5% |
| Immigrants | Belize | 0.0 /100 | #310 | Tragic 6.5% |
| Cape Verdeans | 0.0 /100 | #311 | Tragic 6.5% |
| Colville | 0.0 /100 | #312 | Tragic 6.6% |
| Immigrants | Barbados | 0.0 /100 | #313 | Tragic 6.6% |
| Blacks/African Americans | 0.0 /100 | #314 | Tragic 6.6% |
| Houma | 0.0 /100 | #315 | Tragic 6.7% |
| Immigrants | Dominica | 0.0 /100 | #316 | Tragic 6.7% |
| Shoshone | 0.0 /100 | #317 | Tragic 6.8% |
| Immigrants | Cabo Verde | 0.0 /100 | #318 | Tragic 6.8% |