Filipino vs Zimbabwean Female Unemployment
COMPARE
Filipino
Zimbabwean
Female Unemployment
Female Unemployment Comparison
Filipinos
Zimbabweans
5.0%
FEMALE UNEMPLOYMENT
97.3/ 100
METRIC RATING
81st/ 347
METRIC RANK
4.8%
FEMALE UNEMPLOYMENT
99.7/ 100
METRIC RATING
34th/ 347
METRIC RANK
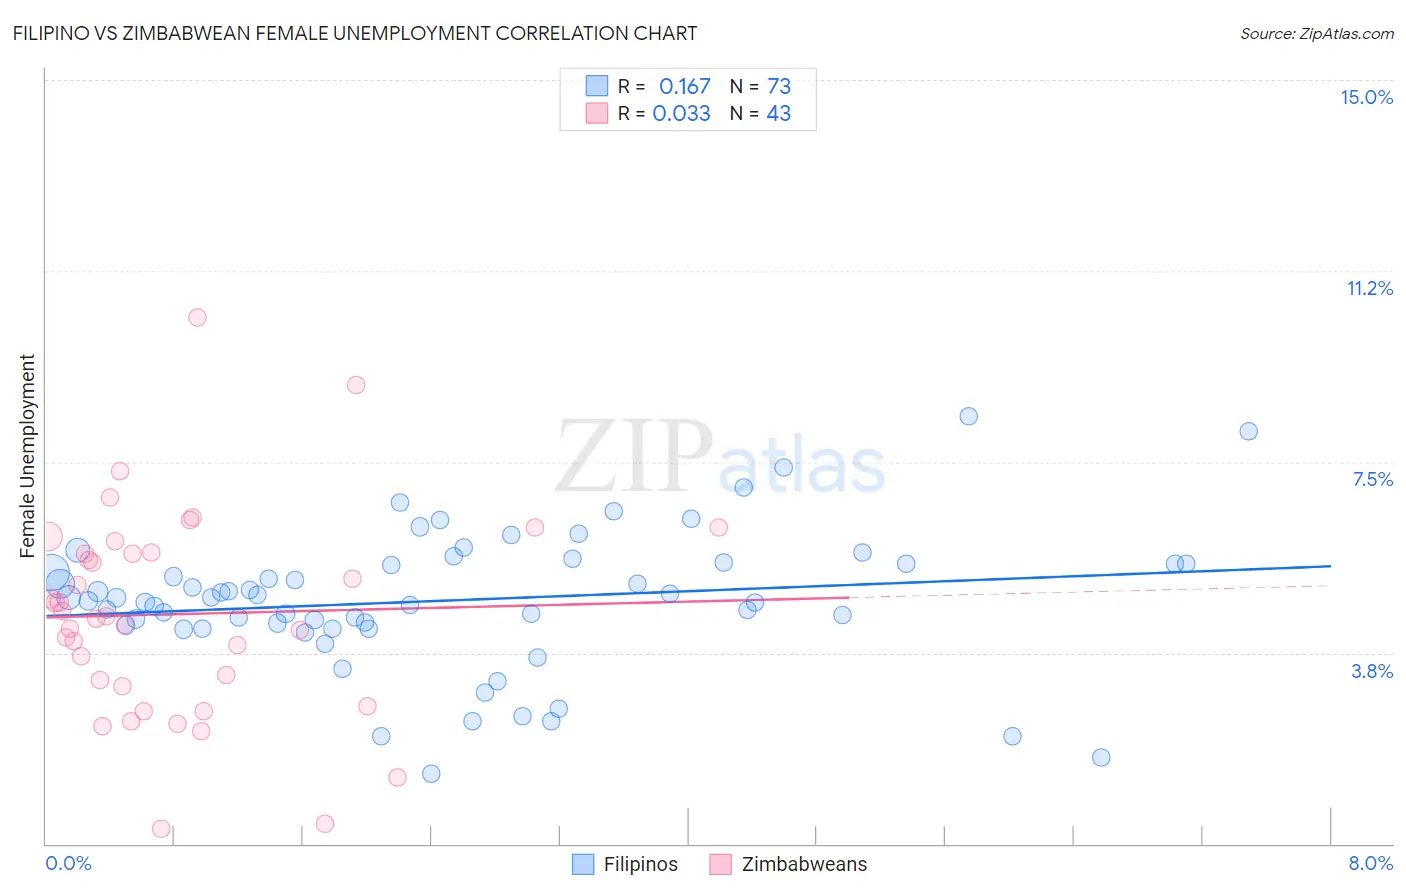
Filipino vs Zimbabwean Female Unemployment Correlation Chart
The statistical analysis conducted on geographies consisting of 253,878,439 people shows a poor positive correlation between the proportion of Filipinos and unemploymnet rate among females in the United States with a correlation coefficient (R) of 0.167 and weighted average of 5.0%. Similarly, the statistical analysis conducted on geographies consisting of 69,190,722 people shows no correlation between the proportion of Zimbabweans and unemploymnet rate among females in the United States with a correlation coefficient (R) of 0.033 and weighted average of 4.8%, a difference of 3.8%.
Female Unemployment Correlation Summary
| Measurement | Filipino | Zimbabwean |
| Minimum | 1.4% | 0.30% |
| Maximum | 8.4% | 10.3% |
| Range | 7.0% | 10.0% |
| Mean | 4.8% | 4.5% |
| Median | 4.8% | 4.5% |
| Interquartile 25% (IQ1) | 4.3% | 3.1% |
| Interquartile 75% (IQ3) | 5.5% | 5.7% |
| Interquartile Range (IQR) | 1.2% | 2.6% |
| Standard Deviation (Sample) | 1.3% | 2.0% |
| Standard Deviation (Population) | 1.3% | 2.0% |
Similar Demographics by Female Unemployment
Demographics Similar to Filipinos by Female Unemployment
In terms of female unemployment, the demographic groups most similar to Filipinos are New Zealander (5.0%, a difference of 0.020%), Immigrants from Australia (5.0%, a difference of 0.050%), Immigrants from Serbia (5.0%, a difference of 0.070%), Canadian (5.0%, a difference of 0.10%), and Turkish (5.0%, a difference of 0.14%).
| Demographics | Rating | Rank | Female Unemployment |
| Immigrants | Bolivia | 98.0 /100 | #74 | Exceptional 5.0% |
| Immigrants | Singapore | 98.0 /100 | #75 | Exceptional 5.0% |
| Immigrants | Venezuela | 97.9 /100 | #76 | Exceptional 5.0% |
| Mongolians | 97.8 /100 | #77 | Exceptional 5.0% |
| Immigrants | Netherlands | 97.8 /100 | #78 | Exceptional 5.0% |
| Turks | 97.6 /100 | #79 | Exceptional 5.0% |
| New Zealanders | 97.4 /100 | #80 | Exceptional 5.0% |
| Filipinos | 97.3 /100 | #81 | Exceptional 5.0% |
| Immigrants | Australia | 97.3 /100 | #82 | Exceptional 5.0% |
| Immigrants | Serbia | 97.2 /100 | #83 | Exceptional 5.0% |
| Canadians | 97.2 /100 | #84 | Exceptional 5.0% |
| Ukrainians | 97.1 /100 | #85 | Exceptional 5.0% |
| Bolivians | 97.1 /100 | #86 | Exceptional 5.0% |
| Venezuelans | 96.9 /100 | #87 | Exceptional 5.0% |
| Immigrants | Sudan | 96.7 /100 | #88 | Exceptional 5.0% |
Demographics Similar to Zimbabweans by Female Unemployment
In terms of female unemployment, the demographic groups most similar to Zimbabweans are Czechoslovakian (4.8%, a difference of 0.030%), French Canadian (4.8%, a difference of 0.060%), Yugoslavian (4.8%, a difference of 0.21%), Slovak (4.8%, a difference of 0.54%), and Pennsylvania German (4.8%, a difference of 0.57%).
| Demographics | Rating | Rank | Female Unemployment |
| British | 99.9 /100 | #27 | Exceptional 4.7% |
| Irish | 99.9 /100 | #28 | Exceptional 4.7% |
| Cypriots | 99.9 /100 | #29 | Exceptional 4.7% |
| Lithuanians | 99.8 /100 | #30 | Exceptional 4.7% |
| Sudanese | 99.8 /100 | #31 | Exceptional 4.8% |
| Slovaks | 99.8 /100 | #32 | Exceptional 4.8% |
| Czechoslovakians | 99.7 /100 | #33 | Exceptional 4.8% |
| Zimbabweans | 99.7 /100 | #34 | Exceptional 4.8% |
| French Canadians | 99.7 /100 | #35 | Exceptional 4.8% |
| Yugoslavians | 99.7 /100 | #36 | Exceptional 4.8% |
| Pennsylvania Germans | 99.6 /100 | #37 | Exceptional 4.8% |
| Northern Europeans | 99.6 /100 | #38 | Exceptional 4.8% |
| Scotch-Irish | 99.6 /100 | #39 | Exceptional 4.8% |
| French | 99.6 /100 | #40 | Exceptional 4.8% |
| Tongans | 99.5 /100 | #41 | Exceptional 4.8% |