Filipino vs Delaware Female Unemployment
COMPARE
Filipino
Delaware
Female Unemployment
Female Unemployment Comparison
Filipinos
Delaware
5.0%
FEMALE UNEMPLOYMENT
97.3/ 100
METRIC RATING
81st/ 347
METRIC RANK
5.5%
FEMALE UNEMPLOYMENT
7.2/ 100
METRIC RATING
223rd/ 347
METRIC RANK
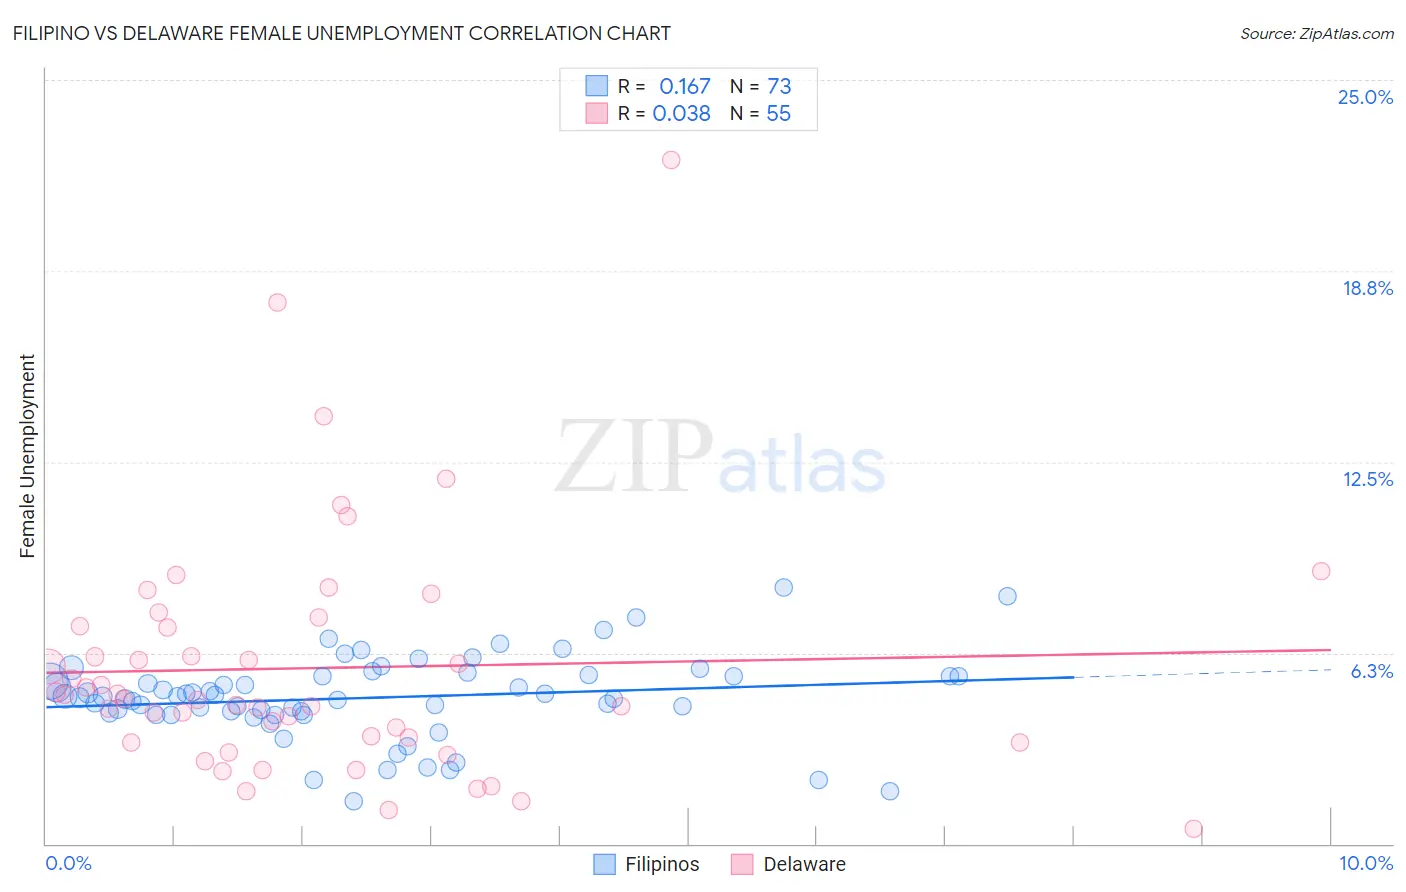
Filipino vs Delaware Female Unemployment Correlation Chart
The statistical analysis conducted on geographies consisting of 253,878,439 people shows a poor positive correlation between the proportion of Filipinos and unemploymnet rate among females in the United States with a correlation coefficient (R) of 0.167 and weighted average of 5.0%. Similarly, the statistical analysis conducted on geographies consisting of 96,046,928 people shows no correlation between the proportion of Delaware and unemploymnet rate among females in the United States with a correlation coefficient (R) of 0.038 and weighted average of 5.5%, a difference of 9.8%.
Female Unemployment Correlation Summary
| Measurement | Filipino | Delaware |
| Minimum | 1.4% | 0.50% |
| Maximum | 8.4% | 22.4% |
| Range | 7.0% | 21.9% |
| Mean | 4.8% | 5.8% |
| Median | 4.8% | 4.8% |
| Interquartile 25% (IQ1) | 4.3% | 3.3% |
| Interquartile 75% (IQ3) | 5.5% | 7.1% |
| Interquartile Range (IQR) | 1.2% | 3.8% |
| Standard Deviation (Sample) | 1.3% | 4.0% |
| Standard Deviation (Population) | 1.3% | 3.9% |
Similar Demographics by Female Unemployment
Demographics Similar to Filipinos by Female Unemployment
In terms of female unemployment, the demographic groups most similar to Filipinos are New Zealander (5.0%, a difference of 0.020%), Immigrants from Australia (5.0%, a difference of 0.050%), Immigrants from Serbia (5.0%, a difference of 0.070%), Canadian (5.0%, a difference of 0.10%), and Turkish (5.0%, a difference of 0.14%).
| Demographics | Rating | Rank | Female Unemployment |
| Immigrants | Bolivia | 98.0 /100 | #74 | Exceptional 5.0% |
| Immigrants | Singapore | 98.0 /100 | #75 | Exceptional 5.0% |
| Immigrants | Venezuela | 97.9 /100 | #76 | Exceptional 5.0% |
| Mongolians | 97.8 /100 | #77 | Exceptional 5.0% |
| Immigrants | Netherlands | 97.8 /100 | #78 | Exceptional 5.0% |
| Turks | 97.6 /100 | #79 | Exceptional 5.0% |
| New Zealanders | 97.4 /100 | #80 | Exceptional 5.0% |
| Filipinos | 97.3 /100 | #81 | Exceptional 5.0% |
| Immigrants | Australia | 97.3 /100 | #82 | Exceptional 5.0% |
| Immigrants | Serbia | 97.2 /100 | #83 | Exceptional 5.0% |
| Canadians | 97.2 /100 | #84 | Exceptional 5.0% |
| Ukrainians | 97.1 /100 | #85 | Exceptional 5.0% |
| Bolivians | 97.1 /100 | #86 | Exceptional 5.0% |
| Venezuelans | 96.9 /100 | #87 | Exceptional 5.0% |
| Immigrants | Sudan | 96.7 /100 | #88 | Exceptional 5.0% |
Demographics Similar to Delaware by Female Unemployment
In terms of female unemployment, the demographic groups most similar to Delaware are Nicaraguan (5.5%, a difference of 0.010%), Brazilian (5.5%, a difference of 0.030%), Iraqi (5.5%, a difference of 0.030%), French American Indian (5.5%, a difference of 0.25%), and Immigrants from Africa (5.4%, a difference of 0.27%).
| Demographics | Rating | Rank | Female Unemployment |
| Comanche | 10.0 /100 | #216 | Poor 5.4% |
| Peruvians | 9.6 /100 | #217 | Tragic 5.4% |
| Bermudans | 9.0 /100 | #218 | Tragic 5.4% |
| South Americans | 8.6 /100 | #219 | Tragic 5.4% |
| Immigrants | Africa | 8.5 /100 | #220 | Tragic 5.4% |
| Brazilians | 7.3 /100 | #221 | Tragic 5.5% |
| Nicaraguans | 7.2 /100 | #222 | Tragic 5.5% |
| Delaware | 7.2 /100 | #223 | Tragic 5.5% |
| Iraqis | 7.1 /100 | #224 | Tragic 5.5% |
| French American Indians | 6.1 /100 | #225 | Tragic 5.5% |
| Immigrants | Peru | 5.9 /100 | #226 | Tragic 5.5% |
| Immigrants | Philippines | 5.3 /100 | #227 | Tragic 5.5% |
| Israelis | 4.8 /100 | #228 | Tragic 5.5% |
| Panamanians | 4.7 /100 | #229 | Tragic 5.5% |
| Immigrants | Uruguay | 4.7 /100 | #230 | Tragic 5.5% |