Apache vs West Indian Male Unemployment
COMPARE
Apache
West Indian
Male Unemployment
Male Unemployment Comparison
Apache
West Indians
8.6%
MALE UNEMPLOYMENT
0.0/ 100
METRIC RATING
338th/ 347
METRIC RANK
6.7%
MALE UNEMPLOYMENT
0.0/ 100
METRIC RATING
304th/ 347
METRIC RANK
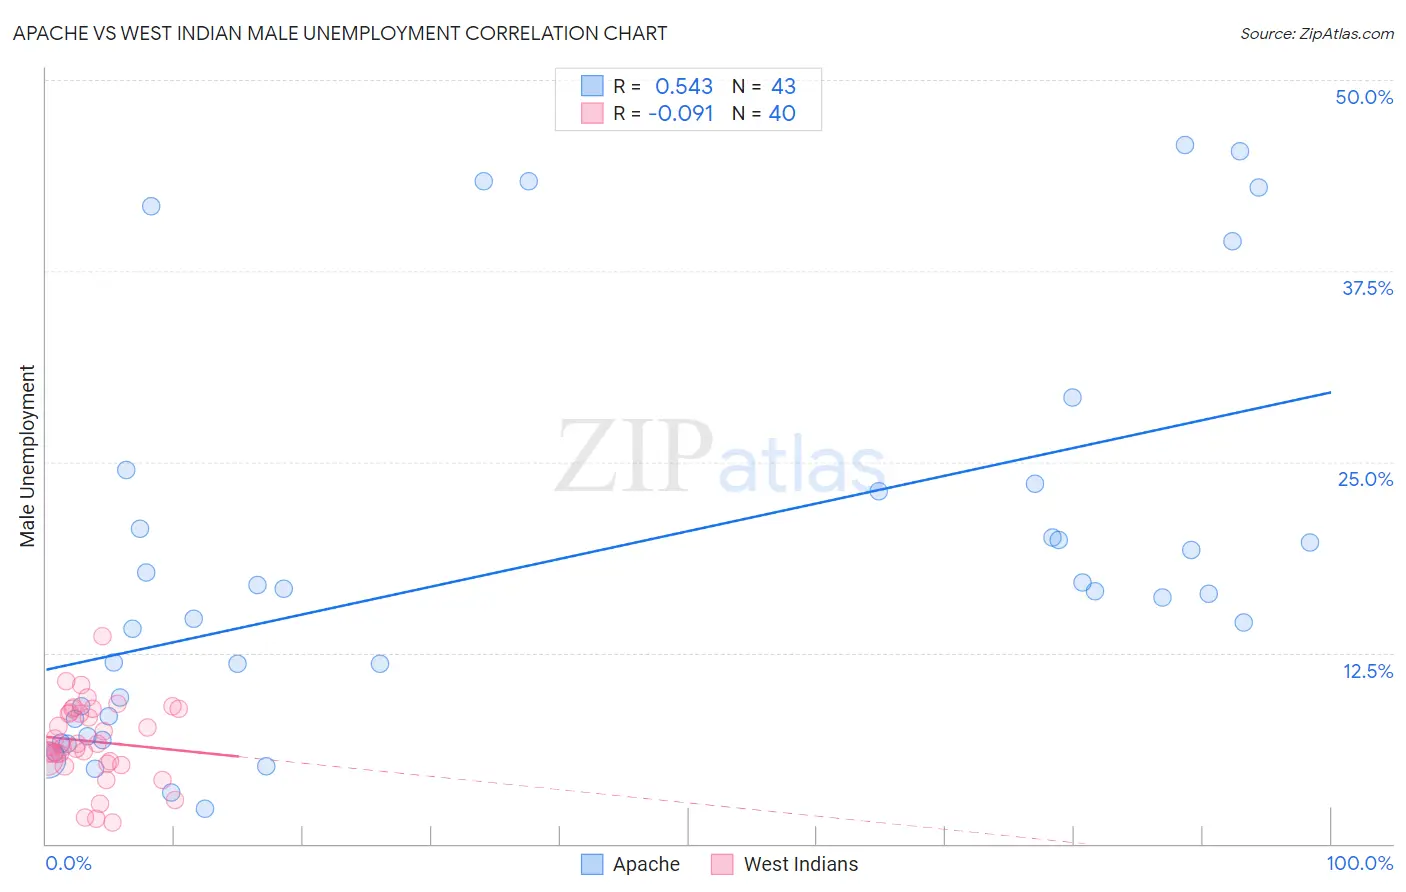
Apache vs West Indian Male Unemployment Correlation Chart
The statistical analysis conducted on geographies consisting of 230,425,231 people shows a substantial positive correlation between the proportion of Apache and unemployment rate among males in the United States with a correlation coefficient (R) of 0.543 and weighted average of 8.6%. Similarly, the statistical analysis conducted on geographies consisting of 253,602,585 people shows a slight negative correlation between the proportion of West Indians and unemployment rate among males in the United States with a correlation coefficient (R) of -0.091 and weighted average of 6.7%, a difference of 29.2%.
Male Unemployment Correlation Summary
| Measurement | Apache | West Indian |
| Minimum | 2.3% | 1.4% |
| Maximum | 45.7% | 13.6% |
| Range | 43.4% | 12.2% |
| Mean | 18.3% | 6.7% |
| Median | 16.4% | 6.4% |
| Interquartile 25% (IQ1) | 8.2% | 5.3% |
| Interquartile 75% (IQ3) | 23.1% | 8.7% |
| Interquartile Range (IQR) | 14.9% | 3.4% |
| Standard Deviation (Sample) | 12.7% | 2.6% |
| Standard Deviation (Population) | 12.6% | 2.6% |
Similar Demographics by Male Unemployment
Demographics Similar to Apache by Male Unemployment
In terms of male unemployment, the demographic groups most similar to Apache are Puerto Rican (8.6%, a difference of 0.15%), Yuman (8.6%, a difference of 0.23%), Pueblo (8.5%, a difference of 1.6%), Tsimshian (8.5%, a difference of 1.7%), and Sioux (8.4%, a difference of 2.6%).
| Demographics | Rating | Rank | Male Unemployment |
| Alaska Natives | 0.0 /100 | #331 | Tragic 8.1% |
| Pima | 0.0 /100 | #332 | Tragic 8.3% |
| Sioux | 0.0 /100 | #333 | Tragic 8.4% |
| Tsimshian | 0.0 /100 | #334 | Tragic 8.5% |
| Pueblo | 0.0 /100 | #335 | Tragic 8.5% |
| Yuman | 0.0 /100 | #336 | Tragic 8.6% |
| Puerto Ricans | 0.0 /100 | #337 | Tragic 8.6% |
| Apache | 0.0 /100 | #338 | Tragic 8.6% |
| Cheyenne | 0.0 /100 | #339 | Tragic 9.8% |
| Alaskan Athabascans | 0.0 /100 | #340 | Tragic 9.8% |
| Navajo | 0.0 /100 | #341 | Tragic 9.8% |
| Tohono O'odham | 0.0 /100 | #342 | Tragic 10.2% |
| Crow | 0.0 /100 | #343 | Tragic 10.6% |
| Hopi | 0.0 /100 | #344 | Tragic 10.8% |
| Arapaho | 0.0 /100 | #345 | Tragic 11.0% |
Demographics Similar to West Indians by Male Unemployment
In terms of male unemployment, the demographic groups most similar to West Indians are Immigrants from West Indies (6.7%, a difference of 0.0%), Trinidadian and Tobagonian (6.7%, a difference of 0.32%), Ute (6.6%, a difference of 0.37%), Immigrants from Trinidad and Tobago (6.7%, a difference of 0.52%), and Immigrants from Jamaica (6.7%, a difference of 0.60%).
| Demographics | Rating | Rank | Male Unemployment |
| Chippewa | 0.0 /100 | #297 | Tragic 6.6% |
| Jamaicans | 0.0 /100 | #298 | Tragic 6.6% |
| Immigrants | Bangladesh | 0.0 /100 | #299 | Tragic 6.6% |
| Vietnamese | 0.0 /100 | #300 | Tragic 6.6% |
| Immigrants | Belize | 0.0 /100 | #301 | Tragic 6.6% |
| Ute | 0.0 /100 | #302 | Tragic 6.6% |
| Immigrants | West Indies | 0.0 /100 | #303 | Tragic 6.7% |
| West Indians | 0.0 /100 | #304 | Tragic 6.7% |
| Trinidadians and Tobagonians | 0.0 /100 | #305 | Tragic 6.7% |
| Immigrants | Trinidad and Tobago | 0.0 /100 | #306 | Tragic 6.7% |
| Immigrants | Jamaica | 0.0 /100 | #307 | Tragic 6.7% |
| Aleuts | 0.0 /100 | #308 | Tragic 6.8% |
| Barbadians | 0.0 /100 | #309 | Tragic 6.9% |
| Blacks/African Americans | 0.0 /100 | #310 | Tragic 6.9% |
| Immigrants | Armenia | 0.0 /100 | #311 | Tragic 6.9% |