Apache vs Immigrants from Czechoslovakia Male Unemployment
COMPARE
Apache
Immigrants from Czechoslovakia
Male Unemployment
Male Unemployment Comparison
Apache
Immigrants from Czechoslovakia
8.6%
MALE UNEMPLOYMENT
0.0/ 100
METRIC RATING
338th/ 347
METRIC RANK
5.1%
MALE UNEMPLOYMENT
91.7/ 100
METRIC RATING
105th/ 347
METRIC RANK
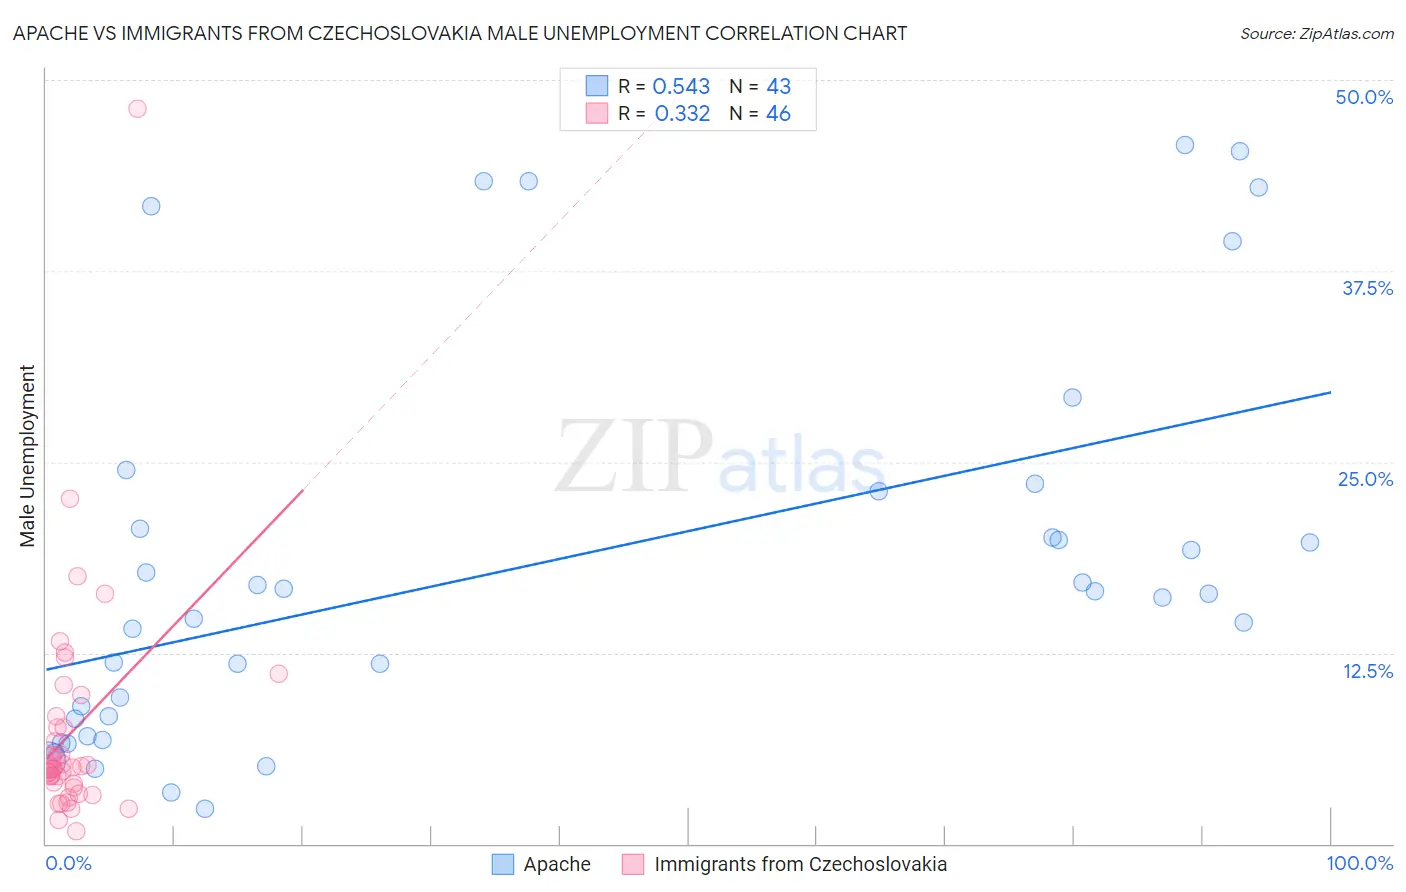
Apache vs Immigrants from Czechoslovakia Male Unemployment Correlation Chart
The statistical analysis conducted on geographies consisting of 230,425,231 people shows a substantial positive correlation between the proportion of Apache and unemployment rate among males in the United States with a correlation coefficient (R) of 0.543 and weighted average of 8.6%. Similarly, the statistical analysis conducted on geographies consisting of 195,196,064 people shows a mild positive correlation between the proportion of Immigrants from Czechoslovakia and unemployment rate among males in the United States with a correlation coefficient (R) of 0.332 and weighted average of 5.1%, a difference of 68.4%.
Male Unemployment Correlation Summary
| Measurement | Apache | Immigrants from Czechoslovakia |
| Minimum | 2.3% | 0.80% |
| Maximum | 45.7% | 48.1% |
| Range | 43.4% | 47.3% |
| Mean | 18.3% | 7.3% |
| Median | 16.4% | 5.0% |
| Interquartile 25% (IQ1) | 8.2% | 3.9% |
| Interquartile 75% (IQ3) | 23.1% | 7.6% |
| Interquartile Range (IQR) | 14.9% | 3.7% |
| Standard Deviation (Sample) | 12.7% | 7.6% |
| Standard Deviation (Population) | 12.6% | 7.5% |
Similar Demographics by Male Unemployment
Demographics Similar to Apache by Male Unemployment
In terms of male unemployment, the demographic groups most similar to Apache are Puerto Rican (8.6%, a difference of 0.15%), Yuman (8.6%, a difference of 0.23%), Pueblo (8.5%, a difference of 1.6%), Tsimshian (8.5%, a difference of 1.7%), and Sioux (8.4%, a difference of 2.6%).
| Demographics | Rating | Rank | Male Unemployment |
| Alaska Natives | 0.0 /100 | #331 | Tragic 8.1% |
| Pima | 0.0 /100 | #332 | Tragic 8.3% |
| Sioux | 0.0 /100 | #333 | Tragic 8.4% |
| Tsimshian | 0.0 /100 | #334 | Tragic 8.5% |
| Pueblo | 0.0 /100 | #335 | Tragic 8.5% |
| Yuman | 0.0 /100 | #336 | Tragic 8.6% |
| Puerto Ricans | 0.0 /100 | #337 | Tragic 8.6% |
| Apache | 0.0 /100 | #338 | Tragic 8.6% |
| Cheyenne | 0.0 /100 | #339 | Tragic 9.8% |
| Alaskan Athabascans | 0.0 /100 | #340 | Tragic 9.8% |
| Navajo | 0.0 /100 | #341 | Tragic 9.8% |
| Tohono O'odham | 0.0 /100 | #342 | Tragic 10.2% |
| Crow | 0.0 /100 | #343 | Tragic 10.6% |
| Hopi | 0.0 /100 | #344 | Tragic 10.8% |
| Arapaho | 0.0 /100 | #345 | Tragic 11.0% |
Demographics Similar to Immigrants from Czechoslovakia by Male Unemployment
In terms of male unemployment, the demographic groups most similar to Immigrants from Czechoslovakia are Immigrants from Chile (5.1%, a difference of 0.010%), Immigrants from Jordan (5.1%, a difference of 0.040%), Immigrants from Ethiopia (5.1%, a difference of 0.040%), Ethiopian (5.1%, a difference of 0.080%), and Immigrants from Nicaragua (5.1%, a difference of 0.090%).
| Demographics | Rating | Rank | Male Unemployment |
| Immigrants | Kuwait | 93.3 /100 | #98 | Exceptional 5.1% |
| Uruguayans | 93.0 /100 | #99 | Exceptional 5.1% |
| Russians | 92.9 /100 | #100 | Exceptional 5.1% |
| German Russians | 92.7 /100 | #101 | Exceptional 5.1% |
| Immigrants | France | 92.7 /100 | #102 | Exceptional 5.1% |
| Immigrants | Jordan | 91.9 /100 | #103 | Exceptional 5.1% |
| Immigrants | Chile | 91.8 /100 | #104 | Exceptional 5.1% |
| Immigrants | Czechoslovakia | 91.7 /100 | #105 | Exceptional 5.1% |
| Immigrants | Ethiopia | 91.5 /100 | #106 | Exceptional 5.1% |
| Ethiopians | 91.3 /100 | #107 | Exceptional 5.1% |
| Immigrants | Nicaragua | 91.2 /100 | #108 | Exceptional 5.1% |
| Immigrants | Pakistan | 90.9 /100 | #109 | Exceptional 5.1% |
| Immigrants | England | 90.8 /100 | #110 | Exceptional 5.1% |
| Immigrants | Eastern Asia | 90.8 /100 | #111 | Exceptional 5.1% |
| Immigrants | Moldova | 90.3 /100 | #112 | Exceptional 5.1% |