Apache vs Guamanian/Chamorro Male Unemployment
COMPARE
Apache
Guamanian/Chamorro
Male Unemployment
Male Unemployment Comparison
Apache
Guamanians/Chamorros
8.6%
MALE UNEMPLOYMENT
0.0/ 100
METRIC RATING
338th/ 347
METRIC RANK
5.4%
MALE UNEMPLOYMENT
12.3/ 100
METRIC RATING
204th/ 347
METRIC RANK
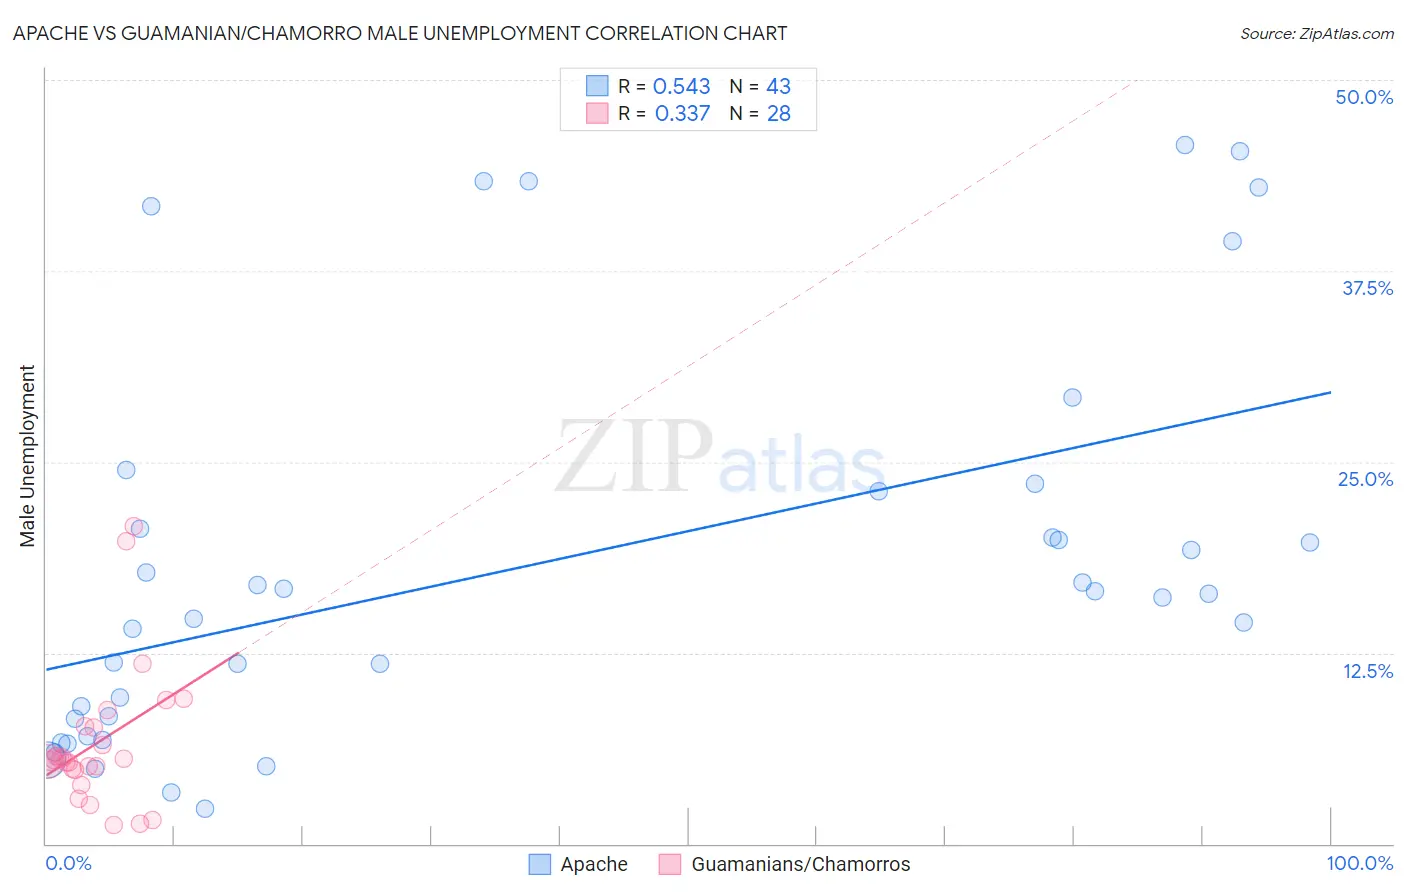
Apache vs Guamanian/Chamorro Male Unemployment Correlation Chart
The statistical analysis conducted on geographies consisting of 230,425,231 people shows a substantial positive correlation between the proportion of Apache and unemployment rate among males in the United States with a correlation coefficient (R) of 0.543 and weighted average of 8.6%. Similarly, the statistical analysis conducted on geographies consisting of 221,364,428 people shows a mild positive correlation between the proportion of Guamanians/Chamorros and unemployment rate among males in the United States with a correlation coefficient (R) of 0.337 and weighted average of 5.4%, a difference of 58.0%.
Male Unemployment Correlation Summary
| Measurement | Apache | Guamanian/Chamorro |
| Minimum | 2.3% | 1.2% |
| Maximum | 45.7% | 20.8% |
| Range | 43.4% | 19.6% |
| Mean | 18.3% | 6.6% |
| Median | 16.4% | 5.5% |
| Interquartile 25% (IQ1) | 8.2% | 4.9% |
| Interquartile 75% (IQ3) | 23.1% | 7.7% |
| Interquartile Range (IQR) | 14.9% | 2.8% |
| Standard Deviation (Sample) | 12.7% | 4.6% |
| Standard Deviation (Population) | 12.6% | 4.5% |
Similar Demographics by Male Unemployment
Demographics Similar to Apache by Male Unemployment
In terms of male unemployment, the demographic groups most similar to Apache are Puerto Rican (8.6%, a difference of 0.15%), Yuman (8.6%, a difference of 0.23%), Pueblo (8.5%, a difference of 1.6%), Tsimshian (8.5%, a difference of 1.7%), and Sioux (8.4%, a difference of 2.6%).
| Demographics | Rating | Rank | Male Unemployment |
| Alaska Natives | 0.0 /100 | #331 | Tragic 8.1% |
| Pima | 0.0 /100 | #332 | Tragic 8.3% |
| Sioux | 0.0 /100 | #333 | Tragic 8.4% |
| Tsimshian | 0.0 /100 | #334 | Tragic 8.5% |
| Pueblo | 0.0 /100 | #335 | Tragic 8.5% |
| Yuman | 0.0 /100 | #336 | Tragic 8.6% |
| Puerto Ricans | 0.0 /100 | #337 | Tragic 8.6% |
| Apache | 0.0 /100 | #338 | Tragic 8.6% |
| Cheyenne | 0.0 /100 | #339 | Tragic 9.8% |
| Alaskan Athabascans | 0.0 /100 | #340 | Tragic 9.8% |
| Navajo | 0.0 /100 | #341 | Tragic 9.8% |
| Tohono O'odham | 0.0 /100 | #342 | Tragic 10.2% |
| Crow | 0.0 /100 | #343 | Tragic 10.6% |
| Hopi | 0.0 /100 | #344 | Tragic 10.8% |
| Arapaho | 0.0 /100 | #345 | Tragic 11.0% |
Demographics Similar to Guamanians/Chamorros by Male Unemployment
In terms of male unemployment, the demographic groups most similar to Guamanians/Chamorros are Immigrants from Laos (5.4%, a difference of 0.090%), Nonimmigrants (5.4%, a difference of 0.10%), Immigrants from Costa Rica (5.5%, a difference of 0.13%), Immigrants from Philippines (5.4%, a difference of 0.15%), and Immigrants from Zaire (5.4%, a difference of 0.17%).
| Demographics | Rating | Rank | Male Unemployment |
| Alsatians | 16.7 /100 | #197 | Poor 5.4% |
| Immigrants | Thailand | 14.7 /100 | #198 | Poor 5.4% |
| Immigrants | Greece | 14.5 /100 | #199 | Poor 5.4% |
| Immigrants | Zaire | 13.7 /100 | #200 | Poor 5.4% |
| Immigrants | Philippines | 13.5 /100 | #201 | Poor 5.4% |
| Immigrants | Nonimmigrants | 13.1 /100 | #202 | Poor 5.4% |
| Immigrants | Laos | 13.0 /100 | #203 | Poor 5.4% |
| Guamanians/Chamorros | 12.3 /100 | #204 | Poor 5.4% |
| Immigrants | Costa Rica | 11.4 /100 | #205 | Poor 5.5% |
| Immigrants | Ukraine | 9.9 /100 | #206 | Tragic 5.5% |
| Immigrants | Syria | 9.3 /100 | #207 | Tragic 5.5% |
| Immigrants | Lebanon | 8.6 /100 | #208 | Tragic 5.5% |
| Immigrants | Middle Africa | 8.3 /100 | #209 | Tragic 5.5% |
| South American Indians | 7.6 /100 | #210 | Tragic 5.5% |
| Israelis | 7.4 /100 | #211 | Tragic 5.5% |