Apache vs Choctaw Male Unemployment
COMPARE
Apache
Choctaw
Male Unemployment
Male Unemployment Comparison
Apache
Choctaw
8.6%
MALE UNEMPLOYMENT
0.0/ 100
METRIC RATING
338th/ 347
METRIC RANK
5.6%
MALE UNEMPLOYMENT
1.6/ 100
METRIC RATING
231st/ 347
METRIC RANK
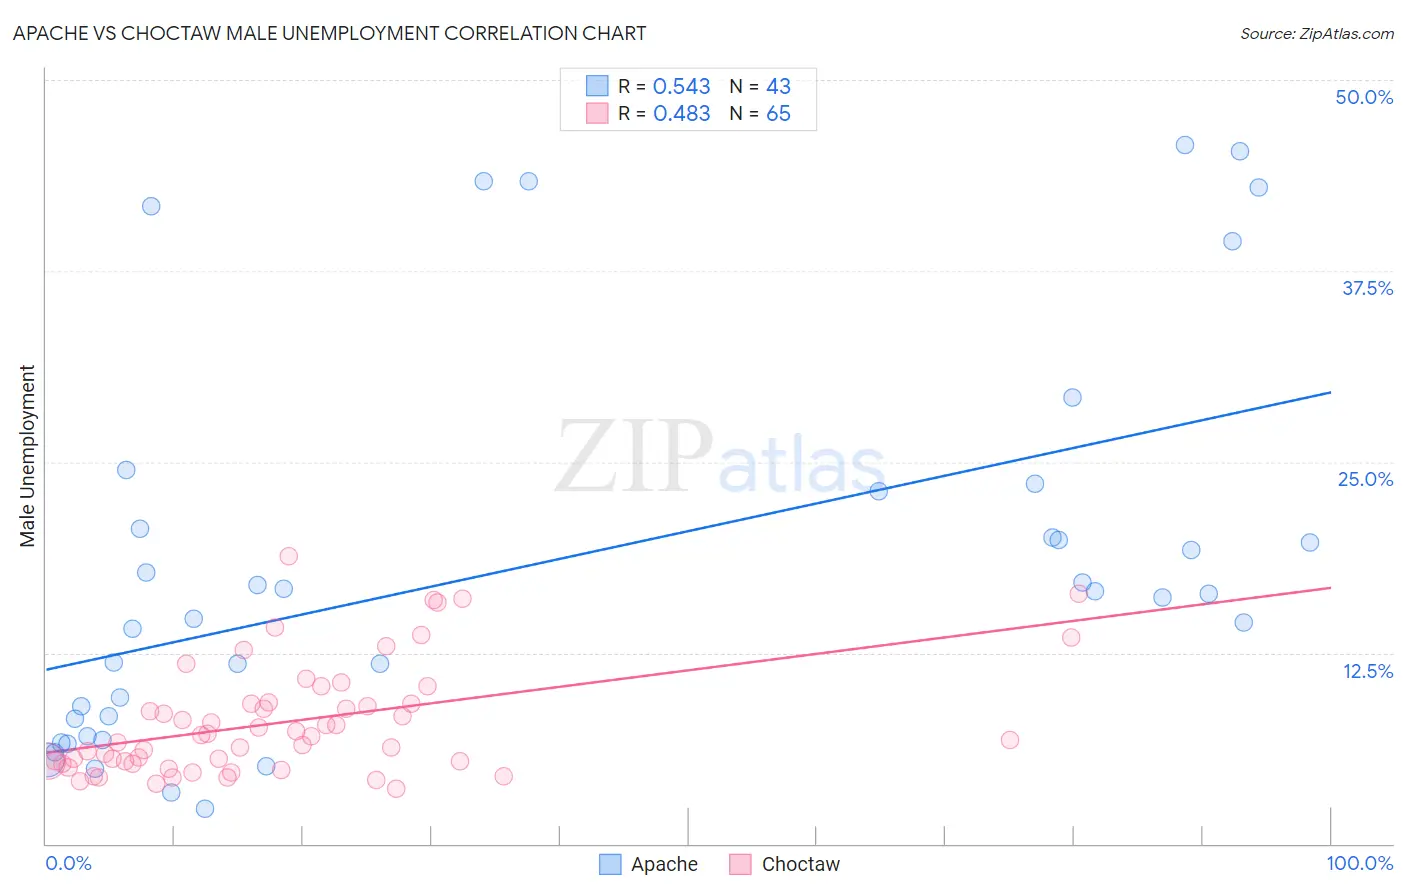
Apache vs Choctaw Male Unemployment Correlation Chart
The statistical analysis conducted on geographies consisting of 230,425,231 people shows a substantial positive correlation between the proportion of Apache and unemployment rate among males in the United States with a correlation coefficient (R) of 0.543 and weighted average of 8.6%. Similarly, the statistical analysis conducted on geographies consisting of 268,476,218 people shows a moderate positive correlation between the proportion of Choctaw and unemployment rate among males in the United States with a correlation coefficient (R) of 0.483 and weighted average of 5.6%, a difference of 53.3%.
Male Unemployment Correlation Summary
| Measurement | Apache | Choctaw |
| Minimum | 2.3% | 3.6% |
| Maximum | 45.7% | 18.8% |
| Range | 43.4% | 15.2% |
| Mean | 18.3% | 8.0% |
| Median | 16.4% | 7.1% |
| Interquartile 25% (IQ1) | 8.2% | 5.3% |
| Interquartile 75% (IQ3) | 23.1% | 9.2% |
| Interquartile Range (IQR) | 14.9% | 3.9% |
| Standard Deviation (Sample) | 12.7% | 3.6% |
| Standard Deviation (Population) | 12.6% | 3.6% |
Similar Demographics by Male Unemployment
Demographics Similar to Apache by Male Unemployment
In terms of male unemployment, the demographic groups most similar to Apache are Puerto Rican (8.6%, a difference of 0.15%), Yuman (8.6%, a difference of 0.23%), Pueblo (8.5%, a difference of 1.6%), Tsimshian (8.5%, a difference of 1.7%), and Sioux (8.4%, a difference of 2.6%).
| Demographics | Rating | Rank | Male Unemployment |
| Alaska Natives | 0.0 /100 | #331 | Tragic 8.1% |
| Pima | 0.0 /100 | #332 | Tragic 8.3% |
| Sioux | 0.0 /100 | #333 | Tragic 8.4% |
| Tsimshian | 0.0 /100 | #334 | Tragic 8.5% |
| Pueblo | 0.0 /100 | #335 | Tragic 8.5% |
| Yuman | 0.0 /100 | #336 | Tragic 8.6% |
| Puerto Ricans | 0.0 /100 | #337 | Tragic 8.6% |
| Apache | 0.0 /100 | #338 | Tragic 8.6% |
| Cheyenne | 0.0 /100 | #339 | Tragic 9.8% |
| Alaskan Athabascans | 0.0 /100 | #340 | Tragic 9.8% |
| Navajo | 0.0 /100 | #341 | Tragic 9.8% |
| Tohono O'odham | 0.0 /100 | #342 | Tragic 10.2% |
| Crow | 0.0 /100 | #343 | Tragic 10.6% |
| Hopi | 0.0 /100 | #344 | Tragic 10.8% |
| Arapaho | 0.0 /100 | #345 | Tragic 11.0% |
Demographics Similar to Choctaw by Male Unemployment
In terms of male unemployment, the demographic groups most similar to Choctaw are Moroccan (5.6%, a difference of 0.030%), Immigrants from Africa (5.6%, a difference of 0.050%), Central American (5.6%, a difference of 0.090%), Seminole (5.6%, a difference of 0.10%), and Immigrants from Panama (5.6%, a difference of 0.11%).
| Demographics | Rating | Rank | Male Unemployment |
| Cherokee | 2.4 /100 | #224 | Tragic 5.6% |
| Panamanians | 1.9 /100 | #225 | Tragic 5.6% |
| Immigrants | Cambodia | 1.8 /100 | #226 | Tragic 5.6% |
| Immigrants | Panama | 1.8 /100 | #227 | Tragic 5.6% |
| Seminole | 1.8 /100 | #228 | Tragic 5.6% |
| Central Americans | 1.8 /100 | #229 | Tragic 5.6% |
| Immigrants | Africa | 1.7 /100 | #230 | Tragic 5.6% |
| Choctaw | 1.6 /100 | #231 | Tragic 5.6% |
| Moroccans | 1.6 /100 | #232 | Tragic 5.6% |
| Somalis | 1.5 /100 | #233 | Tragic 5.6% |
| Immigrants | Somalia | 1.5 /100 | #234 | Tragic 5.6% |
| Immigrants | Honduras | 1.5 /100 | #235 | Tragic 5.6% |
| Guatemalans | 1.2 /100 | #236 | Tragic 5.6% |
| Hondurans | 1.1 /100 | #237 | Tragic 5.6% |
| Native Hawaiians | 1.1 /100 | #238 | Tragic 5.6% |