Apache vs West Indian Associate's Degree
COMPARE
Apache
West Indian
Associate's Degree
Associate's Degree Comparison
Apache
West Indians
36.2%
ASSOCIATE'S DEGREE
0.0/ 100
METRIC RATING
330th/ 347
METRIC RANK
43.8%
ASSOCIATE'S DEGREE
5.2/ 100
METRIC RATING
224th/ 347
METRIC RANK
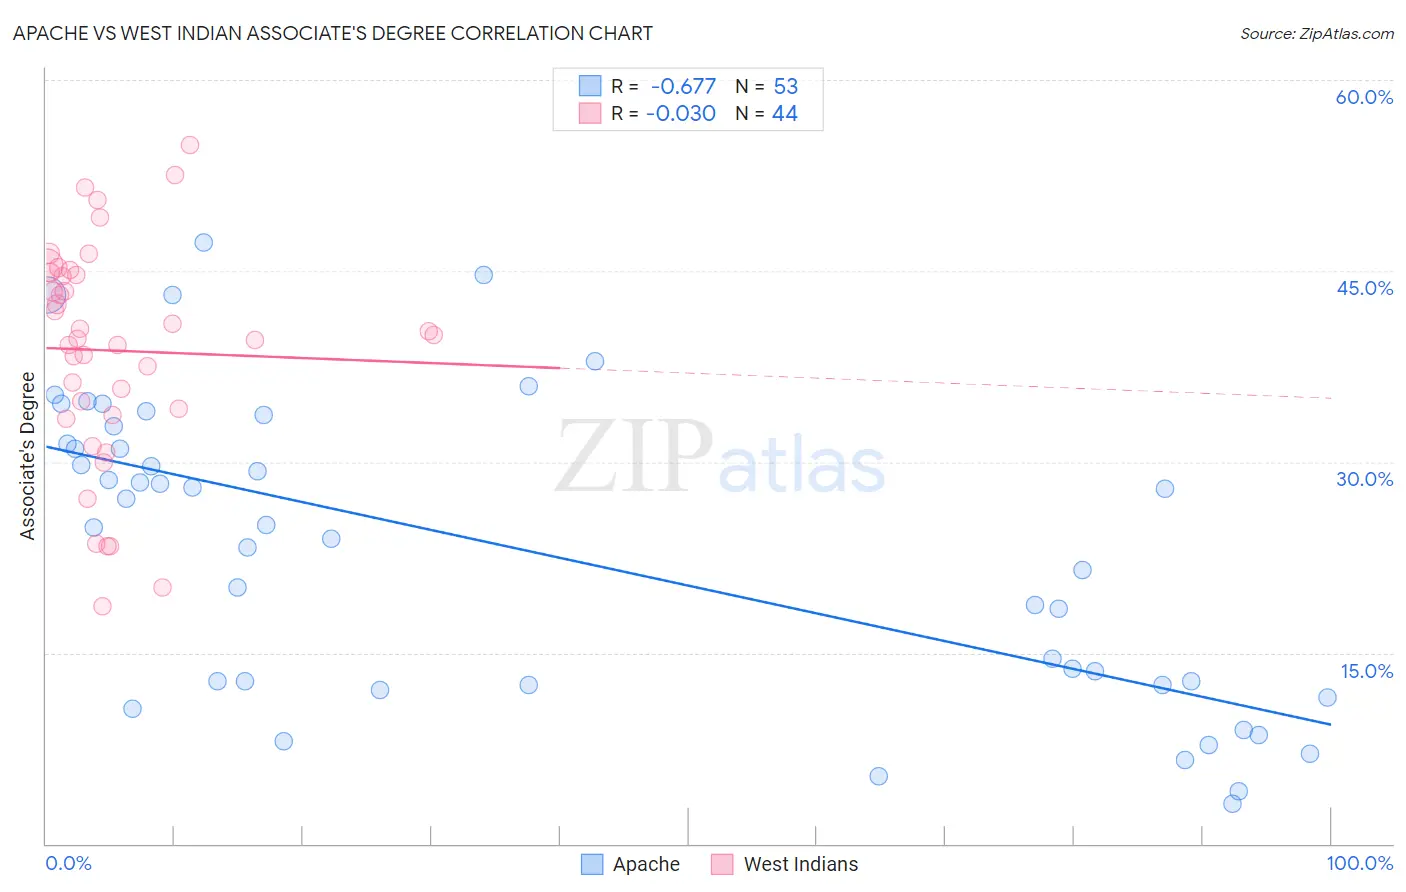
Apache vs West Indian Associate's Degree Correlation Chart
The statistical analysis conducted on geographies consisting of 231,140,415 people shows a significant negative correlation between the proportion of Apache and percentage of population with at least associate's degree education in the United States with a correlation coefficient (R) of -0.677 and weighted average of 36.2%. Similarly, the statistical analysis conducted on geographies consisting of 254,053,499 people shows no correlation between the proportion of West Indians and percentage of population with at least associate's degree education in the United States with a correlation coefficient (R) of -0.030 and weighted average of 43.8%, a difference of 20.9%.
Associate's Degree Correlation Summary
| Measurement | Apache | West Indian |
| Minimum | 3.2% | 18.6% |
| Maximum | 47.2% | 54.9% |
| Range | 44.0% | 36.3% |
| Mean | 23.0% | 38.7% |
| Median | 24.9% | 39.8% |
| Interquartile 25% (IQ1) | 12.5% | 33.9% |
| Interquartile 75% (IQ3) | 32.1% | 44.7% |
| Interquartile Range (IQR) | 19.6% | 10.8% |
| Standard Deviation (Sample) | 11.9% | 8.6% |
| Standard Deviation (Population) | 11.7% | 8.5% |
Similar Demographics by Associate's Degree
Demographics Similar to Apache by Associate's Degree
In terms of associate's degree, the demographic groups most similar to Apache are Paiute (36.4%, a difference of 0.31%), Alaskan Athabascan (36.5%, a difference of 0.60%), Dutch West Indian (36.5%, a difference of 0.61%), Kiowa (36.5%, a difference of 0.63%), and Menominee (36.7%, a difference of 1.2%).
| Demographics | Rating | Rank | Associate's Degree |
| Immigrants | Cabo Verde | 0.0 /100 | #323 | Tragic 36.8% |
| Arapaho | 0.0 /100 | #324 | Tragic 36.7% |
| Menominee | 0.0 /100 | #325 | Tragic 36.7% |
| Kiowa | 0.0 /100 | #326 | Tragic 36.5% |
| Dutch West Indians | 0.0 /100 | #327 | Tragic 36.5% |
| Alaskan Athabascans | 0.0 /100 | #328 | Tragic 36.5% |
| Paiute | 0.0 /100 | #329 | Tragic 36.4% |
| Apache | 0.0 /100 | #330 | Tragic 36.2% |
| Immigrants | Azores | 0.0 /100 | #331 | Tragic 35.6% |
| Immigrants | Central America | 0.0 /100 | #332 | Tragic 35.0% |
| Mexicans | 0.0 /100 | #333 | Tragic 35.0% |
| Natives/Alaskans | 0.0 /100 | #334 | Tragic 34.9% |
| Spanish American Indians | 0.0 /100 | #335 | Tragic 34.9% |
| Hopi | 0.0 /100 | #336 | Tragic 34.6% |
| Lumbee | 0.0 /100 | #337 | Tragic 34.1% |
Demographics Similar to West Indians by Associate's Degree
In terms of associate's degree, the demographic groups most similar to West Indians are Subsaharan African (43.9%, a difference of 0.14%), Guamanian/Chamorro (43.8%, a difference of 0.15%), Barbadian (43.9%, a difference of 0.24%), Immigrants from Burma/Myanmar (43.7%, a difference of 0.37%), and Immigrants from Western Africa (44.1%, a difference of 0.51%).
| Demographics | Rating | Rank | Associate's Degree |
| Immigrants | Immigrants | 10.5 /100 | #217 | Poor 44.5% |
| Spanish | 9.4 /100 | #218 | Tragic 44.4% |
| Whites/Caucasians | 7.5 /100 | #219 | Tragic 44.2% |
| Portuguese | 7.2 /100 | #220 | Tragic 44.1% |
| Immigrants | Western Africa | 6.6 /100 | #221 | Tragic 44.1% |
| Barbadians | 5.8 /100 | #222 | Tragic 43.9% |
| Sub-Saharan Africans | 5.5 /100 | #223 | Tragic 43.9% |
| West Indians | 5.2 /100 | #224 | Tragic 43.8% |
| Guamanians/Chamorros | 4.8 /100 | #225 | Tragic 43.8% |
| Immigrants | Burma/Myanmar | 4.3 /100 | #226 | Tragic 43.7% |
| Trinidadians and Tobagonians | 4.0 /100 | #227 | Tragic 43.6% |
| Hmong | 3.2 /100 | #228 | Tragic 43.4% |
| Immigrants | Trinidad and Tobago | 3.0 /100 | #229 | Tragic 43.3% |
| Immigrants | Barbados | 2.9 /100 | #230 | Tragic 43.3% |
| Liberians | 2.9 /100 | #231 | Tragic 43.3% |