Apache vs Nigerian Male Unemployment
COMPARE
Apache
Nigerian
Male Unemployment
Male Unemployment Comparison
Apache
Nigerians
8.6%
MALE UNEMPLOYMENT
0.0/ 100
METRIC RATING
338th/ 347
METRIC RANK
5.9%
MALE UNEMPLOYMENT
0.0/ 100
METRIC RATING
267th/ 347
METRIC RANK
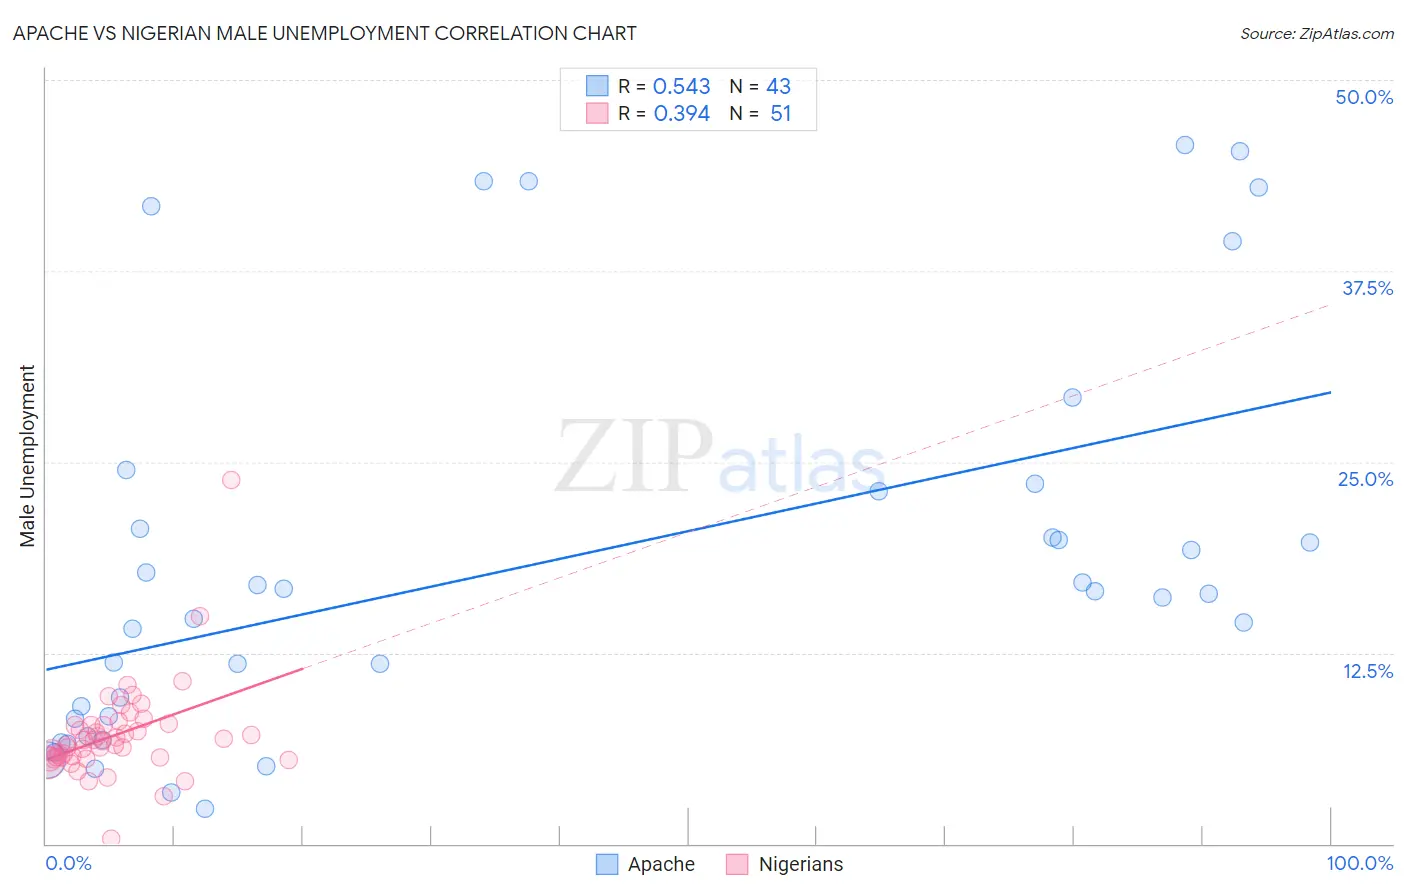
Apache vs Nigerian Male Unemployment Correlation Chart
The statistical analysis conducted on geographies consisting of 230,425,231 people shows a substantial positive correlation between the proportion of Apache and unemployment rate among males in the United States with a correlation coefficient (R) of 0.543 and weighted average of 8.6%. Similarly, the statistical analysis conducted on geographies consisting of 332,030,597 people shows a mild positive correlation between the proportion of Nigerians and unemployment rate among males in the United States with a correlation coefficient (R) of 0.394 and weighted average of 5.9%, a difference of 45.2%.
Male Unemployment Correlation Summary
| Measurement | Apache | Nigerian |
| Minimum | 2.3% | 0.30% |
| Maximum | 45.7% | 23.8% |
| Range | 43.4% | 23.5% |
| Mean | 18.3% | 7.1% |
| Median | 16.4% | 6.7% |
| Interquartile 25% (IQ1) | 8.2% | 5.7% |
| Interquartile 75% (IQ3) | 23.1% | 7.8% |
| Interquartile Range (IQR) | 14.9% | 2.2% |
| Standard Deviation (Sample) | 12.7% | 3.2% |
| Standard Deviation (Population) | 12.6% | 3.2% |
Similar Demographics by Male Unemployment
Demographics Similar to Apache by Male Unemployment
In terms of male unemployment, the demographic groups most similar to Apache are Puerto Rican (8.6%, a difference of 0.15%), Yuman (8.6%, a difference of 0.23%), Pueblo (8.5%, a difference of 1.6%), Tsimshian (8.5%, a difference of 1.7%), and Sioux (8.4%, a difference of 2.6%).
| Demographics | Rating | Rank | Male Unemployment |
| Alaska Natives | 0.0 /100 | #331 | Tragic 8.1% |
| Pima | 0.0 /100 | #332 | Tragic 8.3% |
| Sioux | 0.0 /100 | #333 | Tragic 8.4% |
| Tsimshian | 0.0 /100 | #334 | Tragic 8.5% |
| Pueblo | 0.0 /100 | #335 | Tragic 8.5% |
| Yuman | 0.0 /100 | #336 | Tragic 8.6% |
| Puerto Ricans | 0.0 /100 | #337 | Tragic 8.6% |
| Apache | 0.0 /100 | #338 | Tragic 8.6% |
| Cheyenne | 0.0 /100 | #339 | Tragic 9.8% |
| Alaskan Athabascans | 0.0 /100 | #340 | Tragic 9.8% |
| Navajo | 0.0 /100 | #341 | Tragic 9.8% |
| Tohono O'odham | 0.0 /100 | #342 | Tragic 10.2% |
| Crow | 0.0 /100 | #343 | Tragic 10.6% |
| Hopi | 0.0 /100 | #344 | Tragic 10.8% |
| Arapaho | 0.0 /100 | #345 | Tragic 11.0% |
Demographics Similar to Nigerians by Male Unemployment
In terms of male unemployment, the demographic groups most similar to Nigerians are Bahamian (5.9%, a difference of 0.12%), Bermudan (5.9%, a difference of 0.21%), French American Indian (5.9%, a difference of 0.26%), Immigrants from Nigeria (6.0%, a difference of 0.48%), and Subsaharan African (6.0%, a difference of 0.61%).
| Demographics | Rating | Rank | Male Unemployment |
| Immigrants | Central America | 0.1 /100 | #260 | Tragic 5.8% |
| Liberians | 0.1 /100 | #261 | Tragic 5.8% |
| Immigrants | Portugal | 0.1 /100 | #262 | Tragic 5.9% |
| Immigrants | Latin America | 0.1 /100 | #263 | Tragic 5.9% |
| Immigrants | Mexico | 0.0 /100 | #264 | Tragic 5.9% |
| French American Indians | 0.0 /100 | #265 | Tragic 5.9% |
| Bahamians | 0.0 /100 | #266 | Tragic 5.9% |
| Nigerians | 0.0 /100 | #267 | Tragic 5.9% |
| Bermudans | 0.0 /100 | #268 | Tragic 5.9% |
| Immigrants | Nigeria | 0.0 /100 | #269 | Tragic 6.0% |
| Sub-Saharan Africans | 0.0 /100 | #270 | Tragic 6.0% |
| Blackfeet | 0.0 /100 | #271 | Tragic 6.0% |
| Immigrants | Uzbekistan | 0.0 /100 | #272 | Tragic 6.0% |
| Armenians | 0.0 /100 | #273 | Tragic 6.0% |
| Immigrants | Sierra Leone | 0.0 /100 | #274 | Tragic 6.0% |