Kenyan vs West Indian Male Unemployment
COMPARE
Kenyan
West Indian
Male Unemployment
Male Unemployment Comparison
Kenyans
West Indians
5.2%
MALE UNEMPLOYMENT
79.4/ 100
METRIC RATING
139th/ 347
METRIC RANK
6.7%
MALE UNEMPLOYMENT
0.0/ 100
METRIC RATING
304th/ 347
METRIC RANK
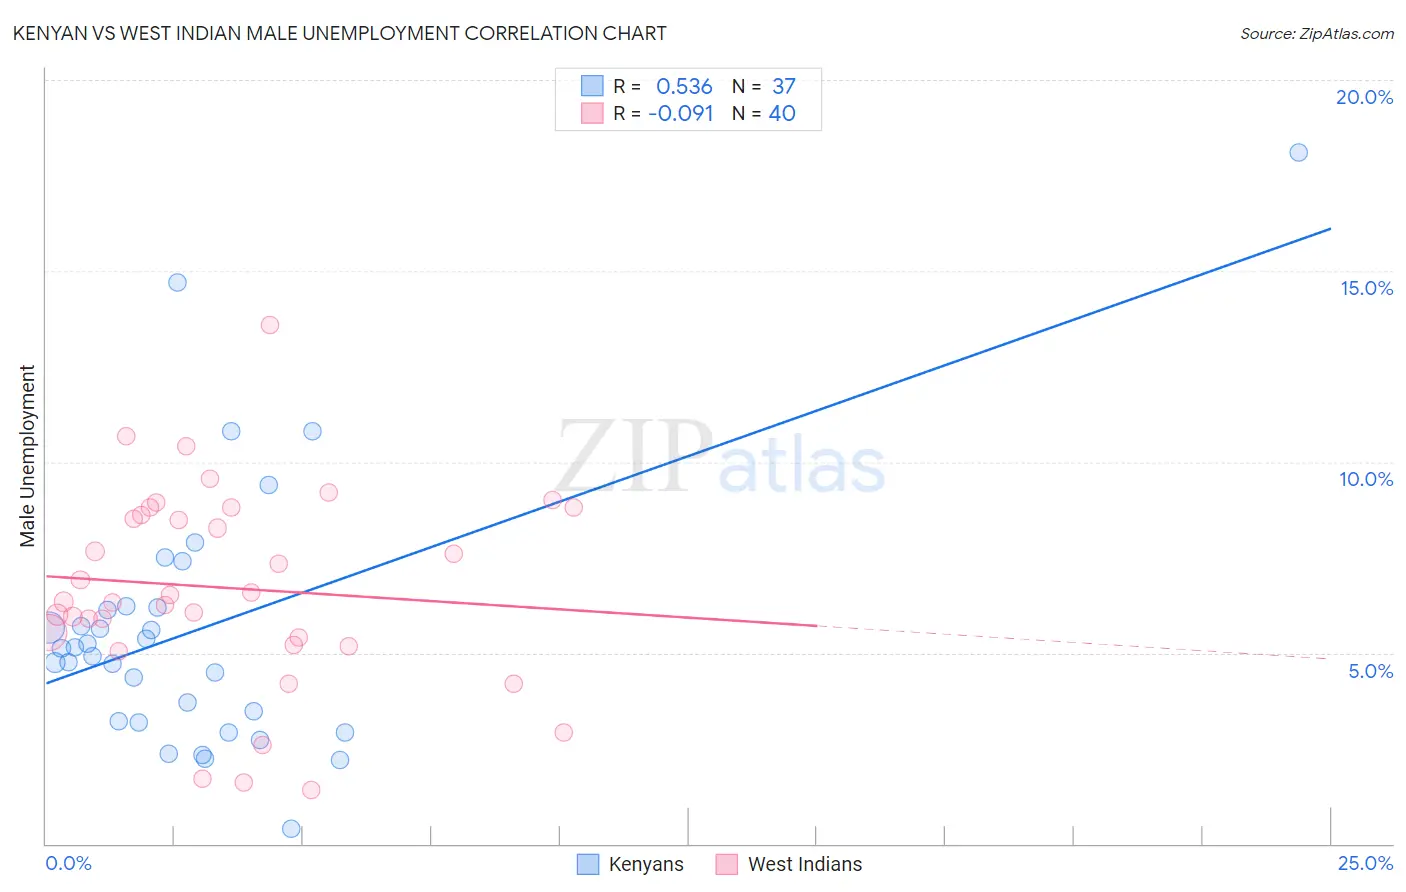
Kenyan vs West Indian Male Unemployment Correlation Chart
The statistical analysis conducted on geographies consisting of 168,001,564 people shows a substantial positive correlation between the proportion of Kenyans and unemployment rate among males in the United States with a correlation coefficient (R) of 0.536 and weighted average of 5.2%. Similarly, the statistical analysis conducted on geographies consisting of 253,602,585 people shows a slight negative correlation between the proportion of West Indians and unemployment rate among males in the United States with a correlation coefficient (R) of -0.091 and weighted average of 6.7%, a difference of 28.3%.
Male Unemployment Correlation Summary
| Measurement | Kenyan | West Indian |
| Minimum | 0.40% | 1.4% |
| Maximum | 18.1% | 13.6% |
| Range | 17.7% | 12.2% |
| Mean | 5.6% | 6.7% |
| Median | 5.1% | 6.4% |
| Interquartile 25% (IQ1) | 3.2% | 5.3% |
| Interquartile 75% (IQ3) | 6.2% | 8.7% |
| Interquartile Range (IQR) | 3.0% | 3.4% |
| Standard Deviation (Sample) | 3.5% | 2.6% |
| Standard Deviation (Population) | 3.5% | 2.6% |
Similar Demographics by Male Unemployment
Demographics Similar to Kenyans by Male Unemployment
In terms of male unemployment, the demographic groups most similar to Kenyans are Brazilian (5.2%, a difference of 0.010%), Immigrants from Croatia (5.2%, a difference of 0.020%), Immigrants from Switzerland (5.2%, a difference of 0.020%), Immigrants from Eastern Africa (5.2%, a difference of 0.030%), and Lebanese (5.2%, a difference of 0.040%).
| Demographics | Rating | Rank | Male Unemployment |
| Chickasaw | 82.9 /100 | #132 | Excellent 5.2% |
| Colombians | 81.1 /100 | #133 | Excellent 5.2% |
| Pakistanis | 80.5 /100 | #134 | Excellent 5.2% |
| Immigrants | Saudi Arabia | 80.1 /100 | #135 | Excellent 5.2% |
| Lebanese | 79.9 /100 | #136 | Good 5.2% |
| Immigrants | Eastern Africa | 79.8 /100 | #137 | Good 5.2% |
| Immigrants | Croatia | 79.7 /100 | #138 | Good 5.2% |
| Kenyans | 79.4 /100 | #139 | Good 5.2% |
| Brazilians | 79.3 /100 | #140 | Good 5.2% |
| Immigrants | Switzerland | 79.2 /100 | #141 | Good 5.2% |
| Fijians | 78.3 /100 | #142 | Good 5.2% |
| Syrians | 78.0 /100 | #143 | Good 5.2% |
| Sri Lankans | 77.9 /100 | #144 | Good 5.2% |
| Macedonians | 77.7 /100 | #145 | Good 5.2% |
| Immigrants | Kenya | 77.6 /100 | #146 | Good 5.2% |
Demographics Similar to West Indians by Male Unemployment
In terms of male unemployment, the demographic groups most similar to West Indians are Immigrants from West Indies (6.7%, a difference of 0.0%), Trinidadian and Tobagonian (6.7%, a difference of 0.32%), Ute (6.6%, a difference of 0.37%), Immigrants from Trinidad and Tobago (6.7%, a difference of 0.52%), and Immigrants from Jamaica (6.7%, a difference of 0.60%).
| Demographics | Rating | Rank | Male Unemployment |
| Chippewa | 0.0 /100 | #297 | Tragic 6.6% |
| Jamaicans | 0.0 /100 | #298 | Tragic 6.6% |
| Immigrants | Bangladesh | 0.0 /100 | #299 | Tragic 6.6% |
| Vietnamese | 0.0 /100 | #300 | Tragic 6.6% |
| Immigrants | Belize | 0.0 /100 | #301 | Tragic 6.6% |
| Ute | 0.0 /100 | #302 | Tragic 6.6% |
| Immigrants | West Indies | 0.0 /100 | #303 | Tragic 6.7% |
| West Indians | 0.0 /100 | #304 | Tragic 6.7% |
| Trinidadians and Tobagonians | 0.0 /100 | #305 | Tragic 6.7% |
| Immigrants | Trinidad and Tobago | 0.0 /100 | #306 | Tragic 6.7% |
| Immigrants | Jamaica | 0.0 /100 | #307 | Tragic 6.7% |
| Aleuts | 0.0 /100 | #308 | Tragic 6.8% |
| Barbadians | 0.0 /100 | #309 | Tragic 6.9% |
| Blacks/African Americans | 0.0 /100 | #310 | Tragic 6.9% |
| Immigrants | Armenia | 0.0 /100 | #311 | Tragic 6.9% |