Apache vs Immigrants from Senegal Male Unemployment
COMPARE
Apache
Immigrants from Senegal
Male Unemployment
Male Unemployment Comparison
Apache
Immigrants from Senegal
8.6%
MALE UNEMPLOYMENT
0.0/ 100
METRIC RATING
338th/ 347
METRIC RANK
6.3%
MALE UNEMPLOYMENT
0.0/ 100
METRIC RATING
288th/ 347
METRIC RANK
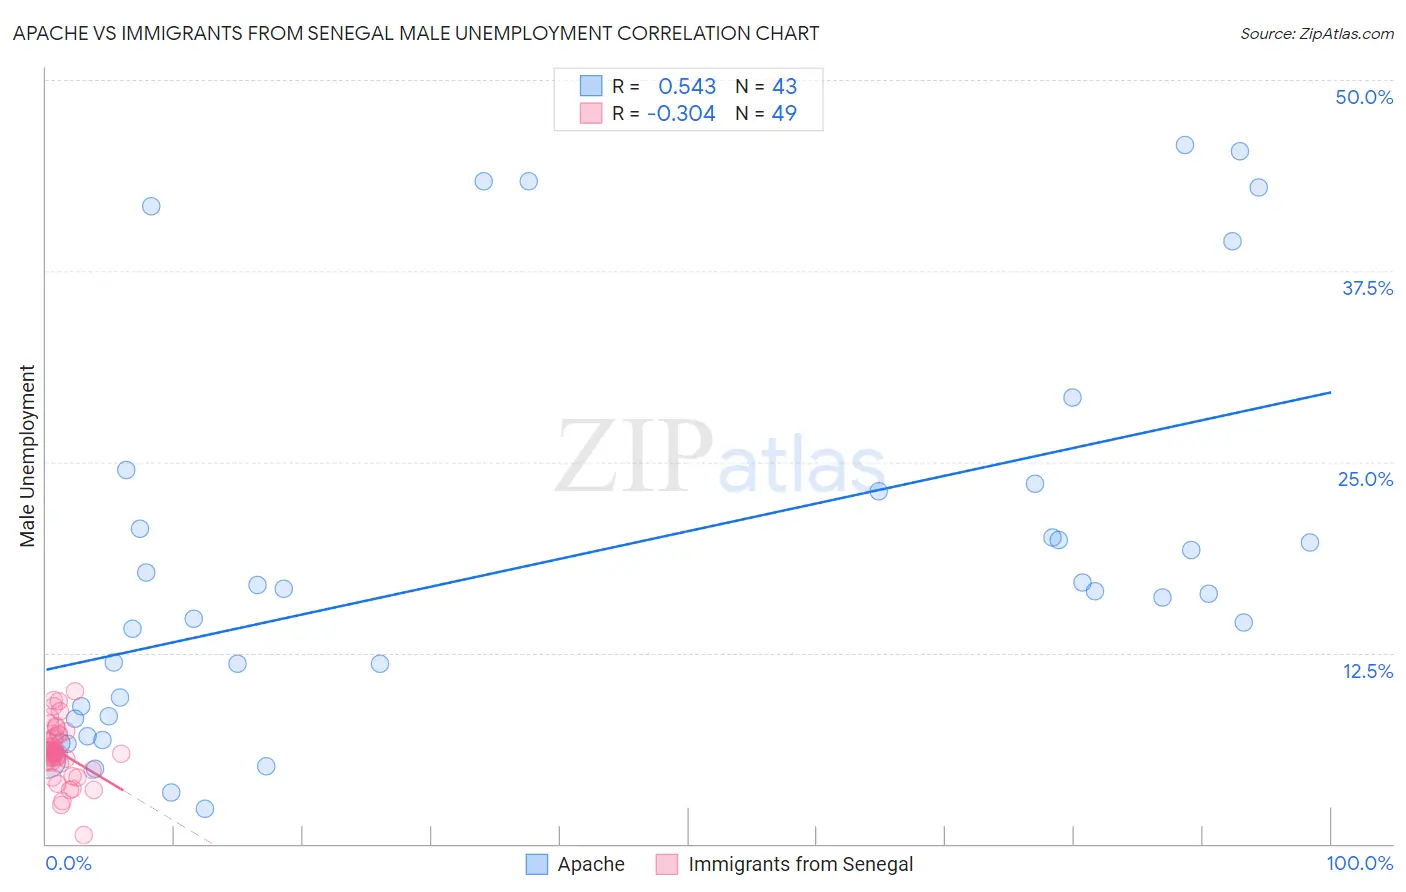
Apache vs Immigrants from Senegal Male Unemployment Correlation Chart
The statistical analysis conducted on geographies consisting of 230,425,231 people shows a substantial positive correlation between the proportion of Apache and unemployment rate among males in the United States with a correlation coefficient (R) of 0.543 and weighted average of 8.6%. Similarly, the statistical analysis conducted on geographies consisting of 90,058,002 people shows a mild negative correlation between the proportion of Immigrants from Senegal and unemployment rate among males in the United States with a correlation coefficient (R) of -0.304 and weighted average of 6.3%, a difference of 37.1%.
Male Unemployment Correlation Summary
| Measurement | Apache | Immigrants from Senegal |
| Minimum | 2.3% | 0.60% |
| Maximum | 45.7% | 10.0% |
| Range | 43.4% | 9.4% |
| Mean | 18.3% | 6.0% |
| Median | 16.4% | 6.0% |
| Interquartile 25% (IQ1) | 8.2% | 5.3% |
| Interquartile 75% (IQ3) | 23.1% | 7.1% |
| Interquartile Range (IQR) | 14.9% | 1.8% |
| Standard Deviation (Sample) | 12.7% | 1.8% |
| Standard Deviation (Population) | 12.6% | 1.8% |
Similar Demographics by Male Unemployment
Demographics Similar to Apache by Male Unemployment
In terms of male unemployment, the demographic groups most similar to Apache are Puerto Rican (8.6%, a difference of 0.15%), Yuman (8.6%, a difference of 0.23%), Pueblo (8.5%, a difference of 1.6%), Tsimshian (8.5%, a difference of 1.7%), and Sioux (8.4%, a difference of 2.6%).
| Demographics | Rating | Rank | Male Unemployment |
| Alaska Natives | 0.0 /100 | #331 | Tragic 8.1% |
| Pima | 0.0 /100 | #332 | Tragic 8.3% |
| Sioux | 0.0 /100 | #333 | Tragic 8.4% |
| Tsimshian | 0.0 /100 | #334 | Tragic 8.5% |
| Pueblo | 0.0 /100 | #335 | Tragic 8.5% |
| Yuman | 0.0 /100 | #336 | Tragic 8.6% |
| Puerto Ricans | 0.0 /100 | #337 | Tragic 8.6% |
| Apache | 0.0 /100 | #338 | Tragic 8.6% |
| Cheyenne | 0.0 /100 | #339 | Tragic 9.8% |
| Alaskan Athabascans | 0.0 /100 | #340 | Tragic 9.8% |
| Navajo | 0.0 /100 | #341 | Tragic 9.8% |
| Tohono O'odham | 0.0 /100 | #342 | Tragic 10.2% |
| Crow | 0.0 /100 | #343 | Tragic 10.6% |
| Hopi | 0.0 /100 | #344 | Tragic 10.8% |
| Arapaho | 0.0 /100 | #345 | Tragic 11.0% |
Demographics Similar to Immigrants from Senegal by Male Unemployment
In terms of male unemployment, the demographic groups most similar to Immigrants from Senegal are Central American Indian (6.3%, a difference of 0.040%), Immigrants from Caribbean (6.3%, a difference of 0.12%), African (6.3%, a difference of 0.33%), Immigrants from Ecuador (6.2%, a difference of 0.76%), and Spanish American Indian (6.2%, a difference of 0.78%).
| Demographics | Rating | Rank | Male Unemployment |
| Sierra Leoneans | 0.0 /100 | #281 | Tragic 6.2% |
| Ecuadorians | 0.0 /100 | #282 | Tragic 6.2% |
| Immigrants | Western Africa | 0.0 /100 | #283 | Tragic 6.2% |
| Spanish American Indians | 0.0 /100 | #284 | Tragic 6.2% |
| Immigrants | Ecuador | 0.0 /100 | #285 | Tragic 6.2% |
| Africans | 0.0 /100 | #286 | Tragic 6.3% |
| Central American Indians | 0.0 /100 | #287 | Tragic 6.3% |
| Immigrants | Senegal | 0.0 /100 | #288 | Tragic 6.3% |
| Immigrants | Caribbean | 0.0 /100 | #289 | Tragic 6.3% |
| U.S. Virgin Islanders | 0.0 /100 | #290 | Tragic 6.4% |
| Immigrants | Azores | 0.0 /100 | #291 | Tragic 6.4% |
| Nepalese | 0.0 /100 | #292 | Tragic 6.4% |
| Haitians | 0.0 /100 | #293 | Tragic 6.4% |
| Senegalese | 0.0 /100 | #294 | Tragic 6.4% |
| Belizeans | 0.0 /100 | #295 | Tragic 6.5% |