Apache vs West Indian Median Earnings
COMPARE
Apache
West Indian
Median Earnings
Median Earnings Comparison
Apache
West Indians
$40,388
MEDIAN EARNINGS
0.0/ 100
METRIC RATING
310th/ 347
METRIC RANK
$45,132
MEDIAN EARNINGS
13.9/ 100
METRIC RATING
224th/ 347
METRIC RANK
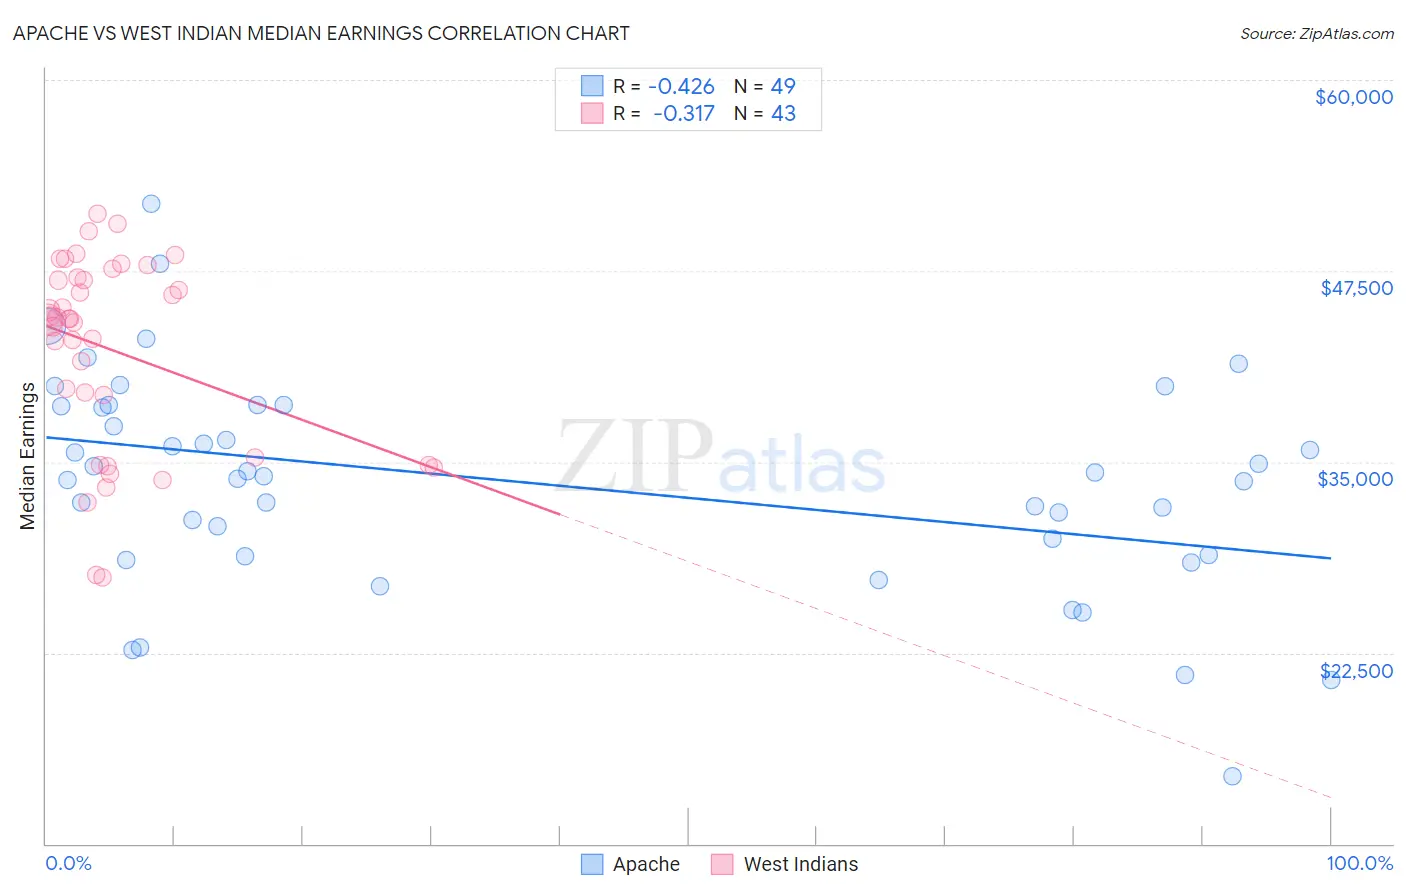
Apache vs West Indian Median Earnings Correlation Chart
The statistical analysis conducted on geographies consisting of 231,119,863 people shows a moderate negative correlation between the proportion of Apache and median earnings in the United States with a correlation coefficient (R) of -0.426 and weighted average of $40,388. Similarly, the statistical analysis conducted on geographies consisting of 254,045,468 people shows a mild negative correlation between the proportion of West Indians and median earnings in the United States with a correlation coefficient (R) of -0.317 and weighted average of $45,132, a difference of 11.7%.
Median Earnings Correlation Summary
| Measurement | Apache | West Indian |
| Minimum | $14,458 | $27,409 |
| Maximum | $51,892 | $51,215 |
| Range | $37,433 | $23,806 |
| Mean | $33,634 | $42,337 |
| Median | $34,056 | $44,343 |
| Interquartile 25% (IQ1) | $28,886 | $35,256 |
| Interquartile 75% (IQ3) | $38,705 | $47,046 |
| Interquartile Range (IQR) | $9,819 | $11,790 |
| Standard Deviation (Sample) | $7,141 | $6,289 |
| Standard Deviation (Population) | $7,068 | $6,215 |
Similar Demographics by Median Earnings
Demographics Similar to Apache by Median Earnings
In terms of median earnings, the demographic groups most similar to Apache are Hispanic or Latino ($40,288, a difference of 0.25%), Chippewa ($40,287, a difference of 0.25%), Choctaw ($40,270, a difference of 0.29%), Cheyenne ($40,233, a difference of 0.39%), and Seminole ($40,233, a difference of 0.39%).
| Demographics | Rating | Rank | Median Earnings |
| Haitians | 0.0 /100 | #303 | Tragic $40,918 |
| Immigrants | Guatemala | 0.0 /100 | #304 | Tragic $40,851 |
| Chickasaw | 0.0 /100 | #305 | Tragic $40,672 |
| Yaqui | 0.0 /100 | #306 | Tragic $40,647 |
| Hondurans | 0.0 /100 | #307 | Tragic $40,638 |
| Cubans | 0.0 /100 | #308 | Tragic $40,619 |
| Immigrants | Haiti | 0.0 /100 | #309 | Tragic $40,550 |
| Apache | 0.0 /100 | #310 | Tragic $40,388 |
| Hispanics or Latinos | 0.0 /100 | #311 | Tragic $40,288 |
| Chippewa | 0.0 /100 | #312 | Tragic $40,287 |
| Choctaw | 0.0 /100 | #313 | Tragic $40,270 |
| Cheyenne | 0.0 /100 | #314 | Tragic $40,233 |
| Seminole | 0.0 /100 | #315 | Tragic $40,233 |
| Immigrants | Honduras | 0.0 /100 | #316 | Tragic $40,195 |
| Fijians | 0.0 /100 | #317 | Tragic $40,193 |
Demographics Similar to West Indians by Median Earnings
In terms of median earnings, the demographic groups most similar to West Indians are Immigrants from Cambodia ($45,090, a difference of 0.090%), Immigrants from Panama ($45,198, a difference of 0.15%), White/Caucasian ($45,197, a difference of 0.15%), Immigrants from Guyana ($45,204, a difference of 0.16%), and Ecuadorian ($45,214, a difference of 0.18%).
| Demographics | Rating | Rank | Median Earnings |
| Tlingit-Haida | 20.5 /100 | #217 | Fair $45,468 |
| Spanish | 19.7 /100 | #218 | Poor $45,432 |
| Dutch | 18.4 /100 | #219 | Poor $45,370 |
| Ecuadorians | 15.3 /100 | #220 | Poor $45,214 |
| Immigrants | Guyana | 15.1 /100 | #221 | Poor $45,204 |
| Immigrants | Panama | 15.0 /100 | #222 | Poor $45,198 |
| Whites/Caucasians | 15.0 /100 | #223 | Poor $45,197 |
| West Indians | 13.9 /100 | #224 | Poor $45,132 |
| Immigrants | Cambodia | 13.2 /100 | #225 | Poor $45,090 |
| Immigrants | Nigeria | 12.2 /100 | #226 | Poor $45,030 |
| Native Hawaiians | 12.2 /100 | #227 | Poor $45,027 |
| Immigrants | Iraq | 11.6 /100 | #228 | Poor $44,988 |
| Scotch-Irish | 10.7 /100 | #229 | Poor $44,924 |
| Immigrants | Western Africa | 10.3 /100 | #230 | Poor $44,893 |
| Japanese | 9.5 /100 | #231 | Tragic $44,825 |