Immigrants from England vs West Indian Male Unemployment
COMPARE
Immigrants from England
West Indian
Male Unemployment
Male Unemployment Comparison
Immigrants from England
West Indians
5.1%
MALE UNEMPLOYMENT
90.8/ 100
METRIC RATING
110th/ 347
METRIC RANK
6.7%
MALE UNEMPLOYMENT
0.0/ 100
METRIC RATING
304th/ 347
METRIC RANK
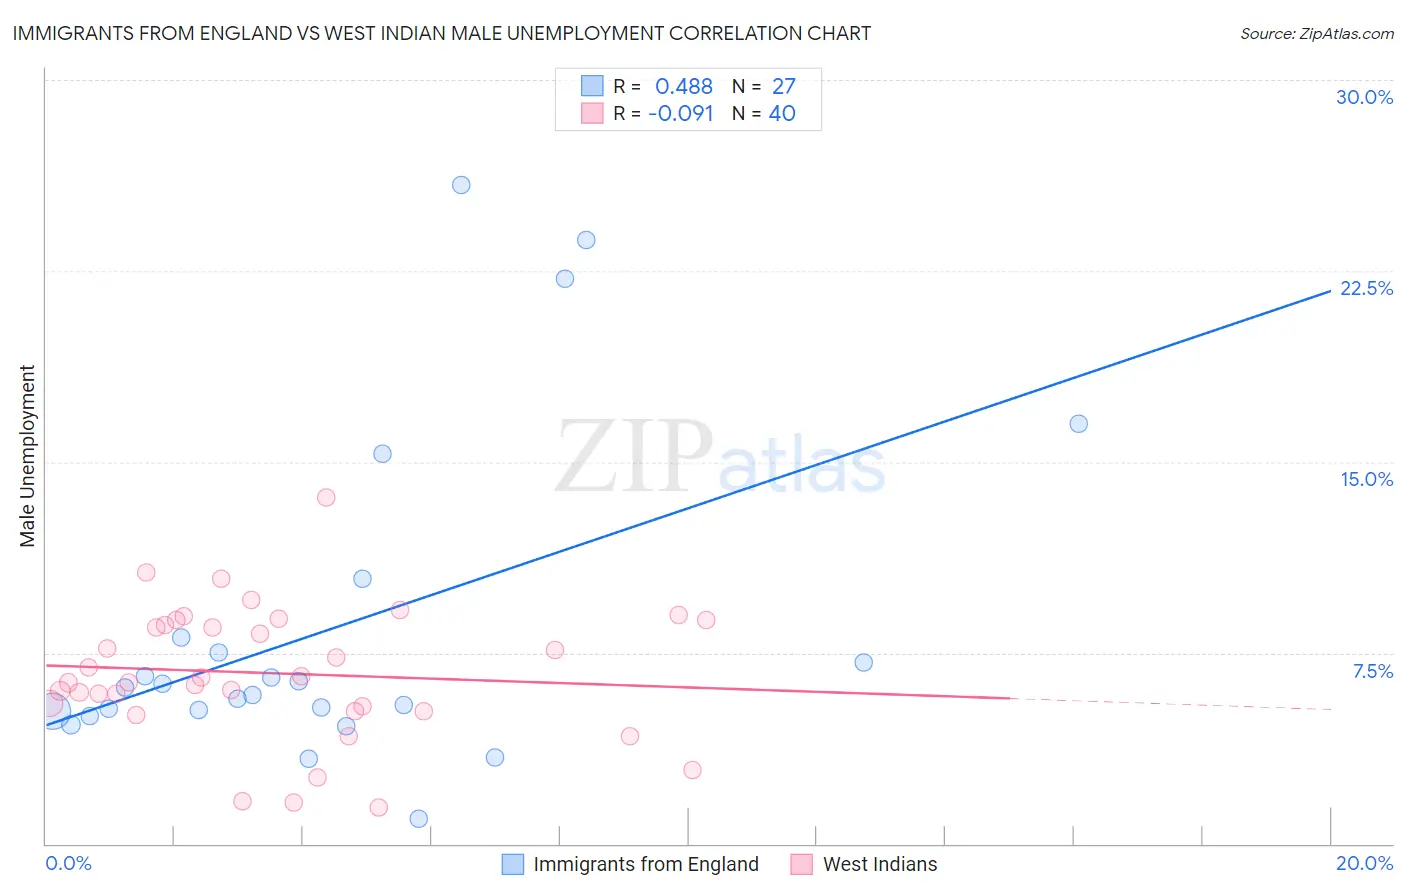
Immigrants from England vs West Indian Male Unemployment Correlation Chart
The statistical analysis conducted on geographies consisting of 390,096,041 people shows a moderate positive correlation between the proportion of Immigrants from England and unemployment rate among males in the United States with a correlation coefficient (R) of 0.488 and weighted average of 5.1%. Similarly, the statistical analysis conducted on geographies consisting of 253,602,585 people shows a slight negative correlation between the proportion of West Indians and unemployment rate among males in the United States with a correlation coefficient (R) of -0.091 and weighted average of 6.7%, a difference of 30.1%.
Male Unemployment Correlation Summary
| Measurement | Immigrants from England | West Indian |
| Minimum | 1.0% | 1.4% |
| Maximum | 25.9% | 13.6% |
| Range | 24.9% | 12.2% |
| Mean | 8.5% | 6.7% |
| Median | 6.1% | 6.4% |
| Interquartile 25% (IQ1) | 5.2% | 5.3% |
| Interquartile 75% (IQ3) | 8.1% | 8.7% |
| Interquartile Range (IQR) | 2.9% | 3.4% |
| Standard Deviation (Sample) | 6.4% | 2.6% |
| Standard Deviation (Population) | 6.3% | 2.6% |
Similar Demographics by Male Unemployment
Demographics Similar to Immigrants from England by Male Unemployment
In terms of male unemployment, the demographic groups most similar to Immigrants from England are Immigrants from Eastern Asia (5.1%, a difference of 0.010%), Immigrants from Pakistan (5.1%, a difference of 0.020%), Immigrants from Nicaragua (5.1%, a difference of 0.080%), Ethiopian (5.1%, a difference of 0.090%), and Immigrants from Moldova (5.1%, a difference of 0.090%).
| Demographics | Rating | Rank | Male Unemployment |
| Immigrants | Jordan | 91.9 /100 | #103 | Exceptional 5.1% |
| Immigrants | Chile | 91.8 /100 | #104 | Exceptional 5.1% |
| Immigrants | Czechoslovakia | 91.7 /100 | #105 | Exceptional 5.1% |
| Immigrants | Ethiopia | 91.5 /100 | #106 | Exceptional 5.1% |
| Ethiopians | 91.3 /100 | #107 | Exceptional 5.1% |
| Immigrants | Nicaragua | 91.2 /100 | #108 | Exceptional 5.1% |
| Immigrants | Pakistan | 90.9 /100 | #109 | Exceptional 5.1% |
| Immigrants | England | 90.8 /100 | #110 | Exceptional 5.1% |
| Immigrants | Eastern Asia | 90.8 /100 | #111 | Exceptional 5.1% |
| Immigrants | Moldova | 90.3 /100 | #112 | Exceptional 5.1% |
| Immigrants | Austria | 90.3 /100 | #113 | Exceptional 5.1% |
| Romanians | 89.8 /100 | #114 | Excellent 5.1% |
| Immigrants | Asia | 89.6 /100 | #115 | Excellent 5.1% |
| Immigrants | Denmark | 89.4 /100 | #116 | Excellent 5.1% |
| Estonians | 89.0 /100 | #117 | Excellent 5.1% |
Demographics Similar to West Indians by Male Unemployment
In terms of male unemployment, the demographic groups most similar to West Indians are Immigrants from West Indies (6.7%, a difference of 0.0%), Trinidadian and Tobagonian (6.7%, a difference of 0.32%), Ute (6.6%, a difference of 0.37%), Immigrants from Trinidad and Tobago (6.7%, a difference of 0.52%), and Immigrants from Jamaica (6.7%, a difference of 0.60%).
| Demographics | Rating | Rank | Male Unemployment |
| Chippewa | 0.0 /100 | #297 | Tragic 6.6% |
| Jamaicans | 0.0 /100 | #298 | Tragic 6.6% |
| Immigrants | Bangladesh | 0.0 /100 | #299 | Tragic 6.6% |
| Vietnamese | 0.0 /100 | #300 | Tragic 6.6% |
| Immigrants | Belize | 0.0 /100 | #301 | Tragic 6.6% |
| Ute | 0.0 /100 | #302 | Tragic 6.6% |
| Immigrants | West Indies | 0.0 /100 | #303 | Tragic 6.7% |
| West Indians | 0.0 /100 | #304 | Tragic 6.7% |
| Trinidadians and Tobagonians | 0.0 /100 | #305 | Tragic 6.7% |
| Immigrants | Trinidad and Tobago | 0.0 /100 | #306 | Tragic 6.7% |
| Immigrants | Jamaica | 0.0 /100 | #307 | Tragic 6.7% |
| Aleuts | 0.0 /100 | #308 | Tragic 6.8% |
| Barbadians | 0.0 /100 | #309 | Tragic 6.9% |
| Blacks/African Americans | 0.0 /100 | #310 | Tragic 6.9% |
| Immigrants | Armenia | 0.0 /100 | #311 | Tragic 6.9% |